
Oil bulls pushed the price of black gold, but the commodity is still struggling with the impact of candlestick formations. What does it mean?
Technical Picture of Crude Oil
In yesterday’s article on crude oil, you could read the following:
(…) taking into account the buy signal generated by the Stochastic Oscillator in the previous week, the bulls may make another attempt to attack the mentioned resistance zone before they completely lose their strength.
If this is the case, we could see an increase to the 200-day moving average or even to around $77.60, where the 78.6% Fibonacci retracement is.
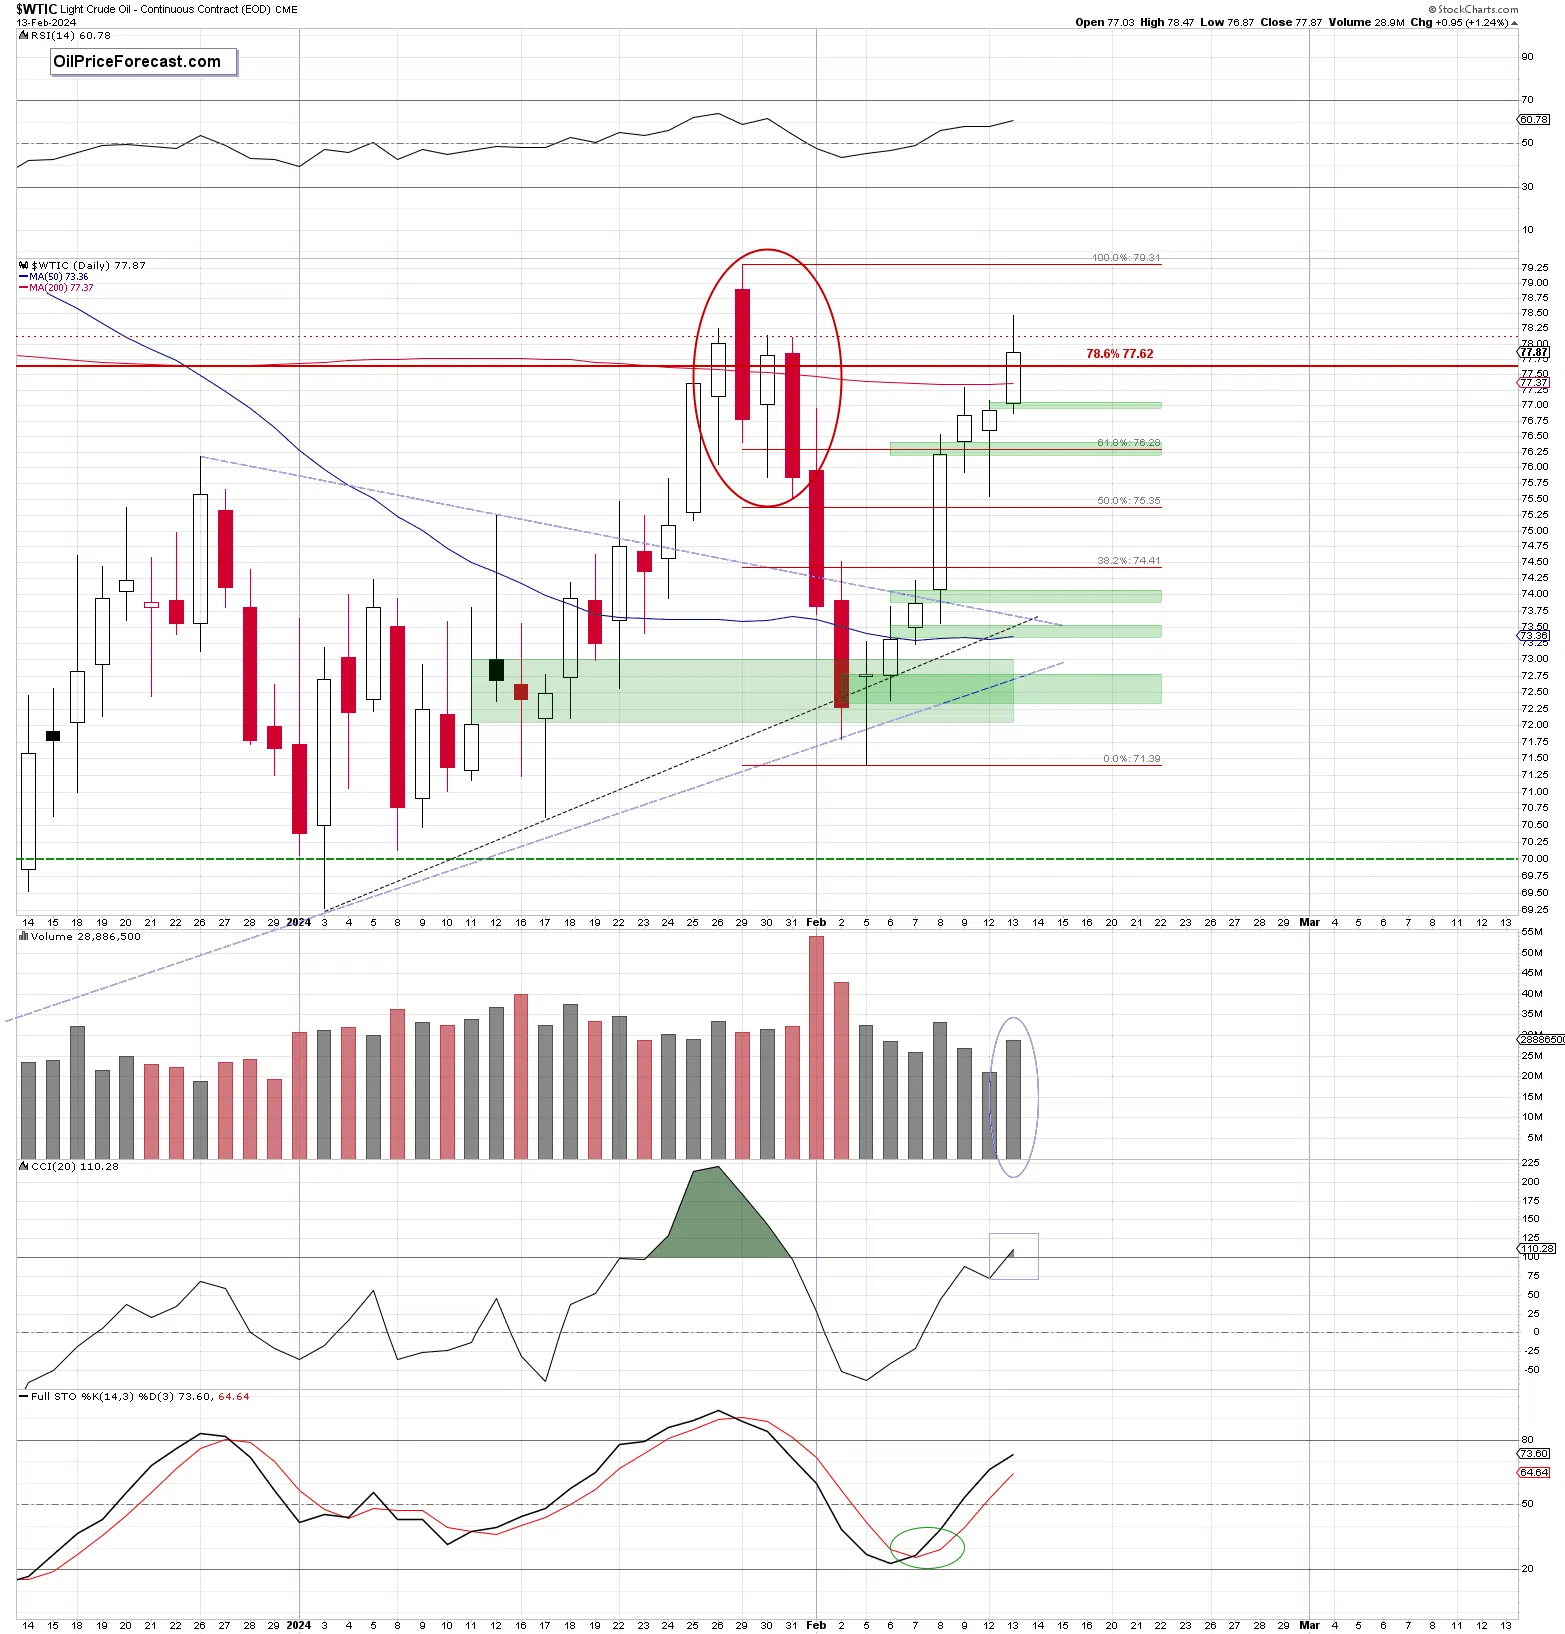
Looking at the daily chart, we see that the situation developed in tune with the above scenario, and crude oil extended gains during yesterday’s session.
The start of the session turned out to be a breakthrough for oil bulls because the day began with a green pro-growth price gap ($76.92-$77.03) that encouraged buyers to make further purchases and push prices to higher levels.
Thanks to their action, the commodity moved above the 200-day moving average, which gave the bulls even more confidence in their own strength and encouraged them to attack the 78.6% Fibonacci retracement mentioned in the latest Oil Trading Alerts.
A good start to the day and an increase above the mentioned moving average lured even more buyers to the trading floor, who together managed to climb to even higher price levels. As a result, the price of black gold moved above $78, which led to a test of the strength of the bearish engulfing pattern created on Jan.31.
Although oil bulls moved slightly above it, this candlestick formation together with another bearish engulfing pattern (from Jan.29) encouraged the bears to defend their important allies. Their comeback to the trading floor led to a pullback and a closure of the day below the top of both candlestick formations.
At this point, it is worth keeping in mind that at the same time, crude oil climbed to one more very important resistance seen from the weekly perspective. Let’s take a look below.
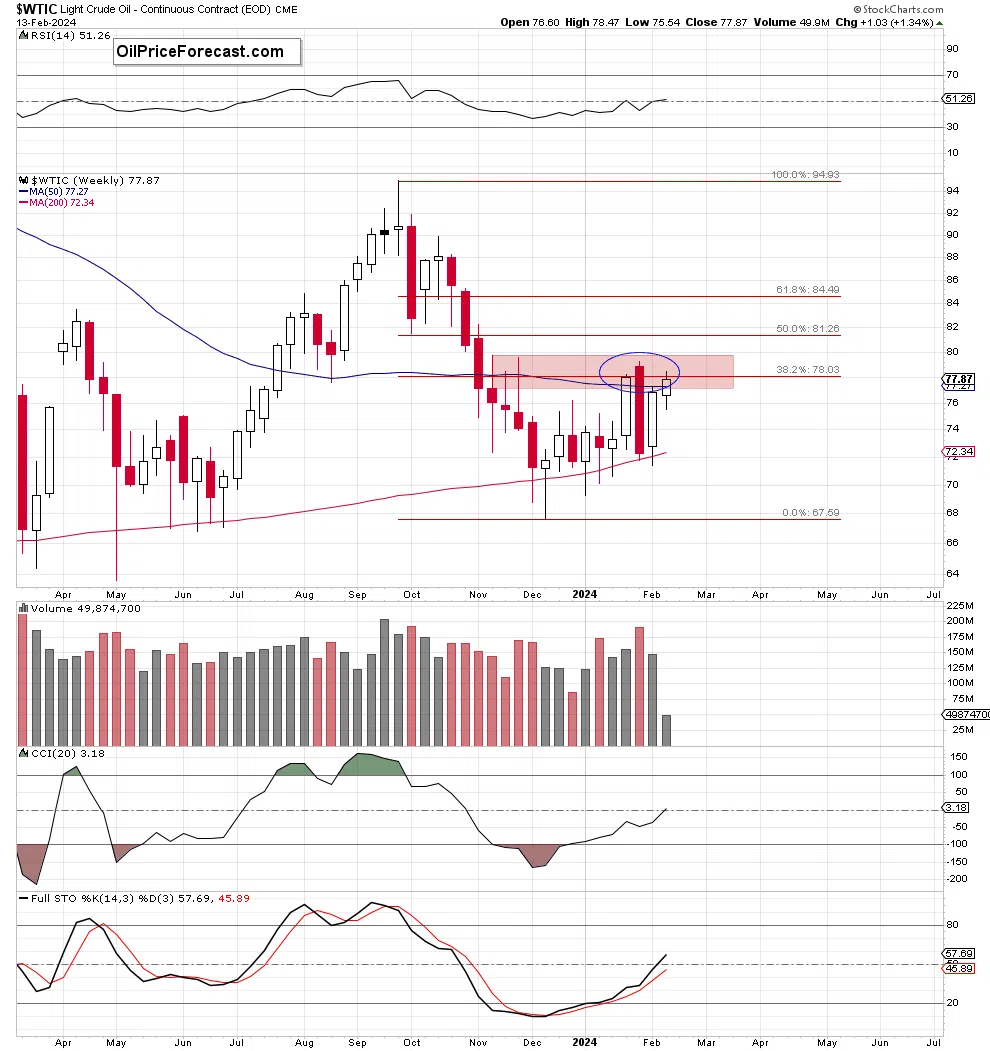
From this perspective, we see that the commodity also tested the strength of the 38.2% Fibonacci retirement, which, together with a big bearish engulfing candlestick formation, successfully stopped the buyers at the end of the previous month.
What’s next?
Yesterday, the buyers gained another ally at the beginning of the day (the green gap, which now serves as the nearest support), which together with the buy signal (generated in the previous week by the Stochastic Oscillator) and increased volume that accompanied yesterday’s upswing suggests that they may want to re-test the bear's strength and determination to keep their valuable allies (the mentioned 38.2% Fibonacci retracement and all three bearish engulfing formations).
Nevertheless, the prolonged upper shadow of yesterday’s white candle suggests that the sellers won't give up without a fight. Therefore, in my opinion, it is worth monitoring the behavior of market participants very carefully in this key resistance zone because the result of the battles played here will determine the next bigger move.
What might a bullish scenario look like?
If buyers manage to close the session above the mentioned resistance zone and neutralize the pro-declining candlestick formations (and their negative impact on price behavior), the path to the barrier of $80 or even to the next significant Fibonacci retracement (the 50% retracement marked on the weekly chart at around 81.26) may be open.
What could happen if the bears win and take control of the trading floor?
In this case, we will likely see a reversal and a test of the strength of individual price gaps that serve as support for the bulls.
Before the summary, please keep in mind that today's data from EIA on crude oil inventories etc. may also be an additional factor that is likely to influence the fate of prices and market participants. If the numbers disappoint market participants (they are more unfavorable than the forecasts), the bears will have additional motivation to act, and the probability of pro-declining scenario will increase. On the other hand, if today's data support the demand side of the market, an attack on the peaks seen at the end of last month will be very likely.
Summing up, crude oil moved higher one more time and the bulls gained another price gap, which serves as the nearest support. However, the proximity to the nearest strong resistances and the uncertainty regarding today's data requires great caution in this area. Therefore, in my opinion, it is worth waiting for the outcome of the battle between market participants. Stay tuned.
Related: Crude Oil: Gap vs. Resistance Area