
The average 2024 Wall Street S&P 500 forecast is for a gain of 6.50% next year. In the past, a 6.50% expectation, while slightly lower than historical averages, was a no-brainer when choosing between stocks and sub-2.5% bonds. Today, that calculus has changed dramatically, with interest rates offering respectable yields. Since stock-bond allocation decisions are now tricker than we are accustomed to, let’s walk through the differences in evaluating stocks and bond cash flows. That discussion, along with an important graph we will share, shows why we should keep it simple stupid or KISS with bonds.
Equity Evaluation
We recently analyzed a stock that required its five-year prior earnings growth. To source the data, we used three reliable and popular industry resources. We got three distinct answers. If it’s that challenging to get past data, consider the difficulty in forecasting future earnings and cash flows.
To properly evaluate a stock, one must assess the future cash flows of a company. Such entails macroeconomic forecasts of the global economy, reliable information on its sales breakdown by product, complete insight into its competitors and potential competitors, and knowledge of new products. Those are just the tip of the iceberg. There are many other factors, some in the company’s control and many outside of it.
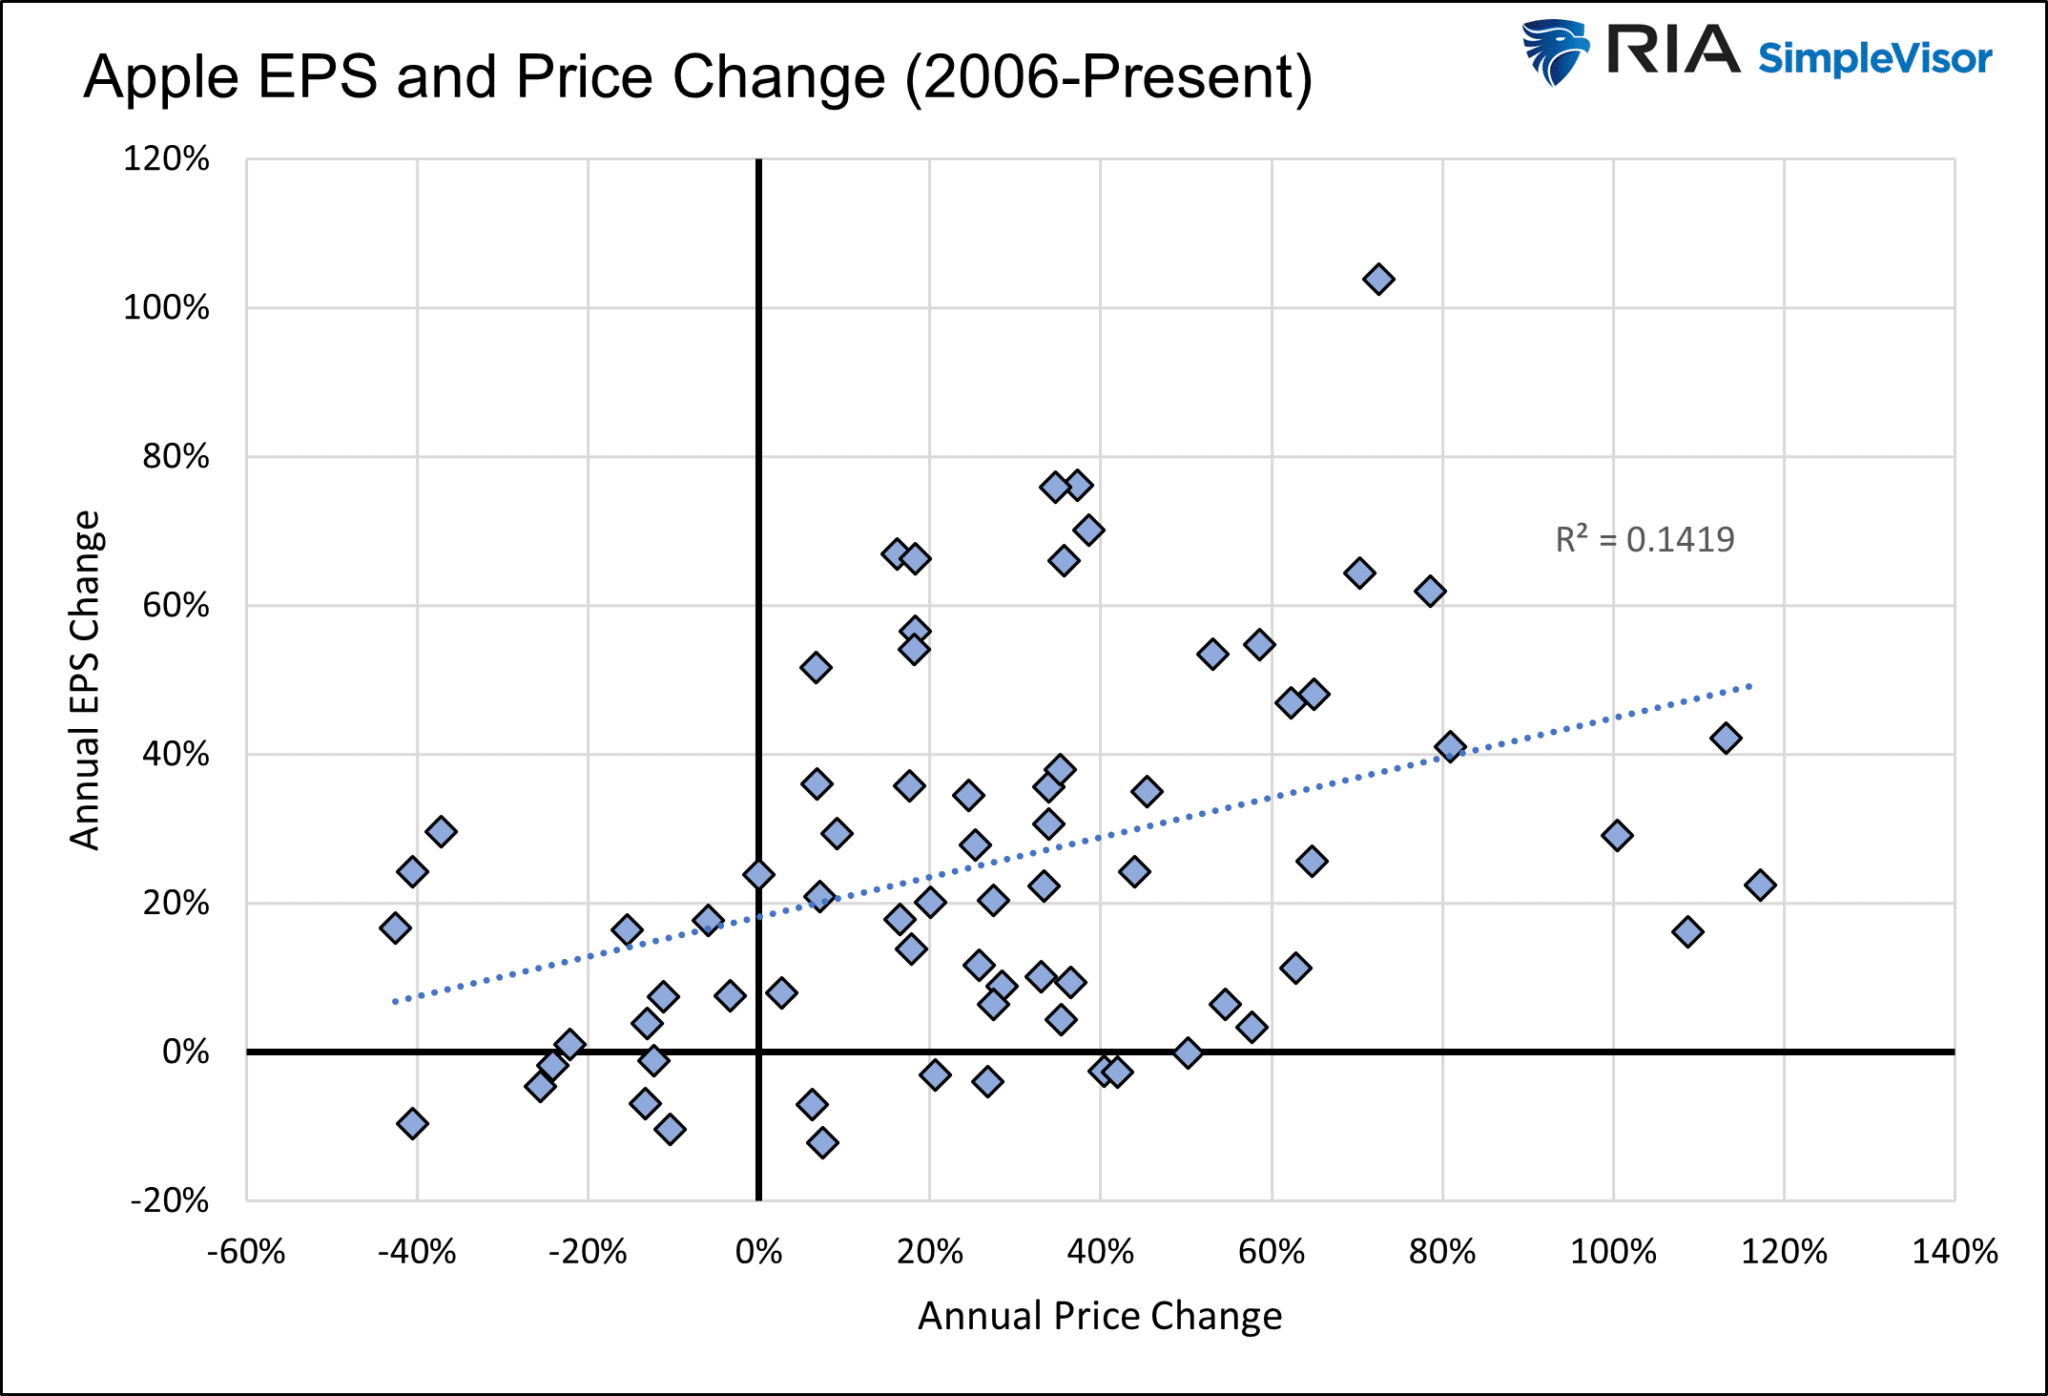
Even if you perfectly predicted earnings for a company, there is no guarantee the stock would perform as you may have thought. For example, the scatter plot shows one-year changes in Apple’s price versus the one-year change in earnings. The R-squared of 0.149 denotes little correlation between earnings and price in the short term. Lengthening the analysis to five-year periods increases the R-squared to 0.37, but the relationship is still not statistically significant.
Predicting stock returns is extremely difficult and fraught with many risks. As such, most investors rely on historical returns and current valuations and often forgo in-depth forecasting.
Bond Math
Unlike stocks, estimating a bond’s potential return over its maturity span is straightforward. Forming return expectations for shorter periods within a bond’s lifespan is also not very difficult.
If you buy a bond at par with a 5% coupon, you will receive 5% annually and get your principal back at maturity. Sometimes, you may buy a bond at a discount or premium to the par value. If so, you will still receive the coupon, and you will also make or lose the difference between the price you paid and par.
Forecasting returns over shorter periods within a bond’s maturity span is a little more complicated. But, it is relatively simple compared to forecasting stock prices. The bond investor will receive the coupon. However, the price change over the period is predicated on changes in its yield. Therefore, if we can predict the yield, we have a good approximation for price and total return.
As we wrote in The Bond Market Hides Tremendous Opportunity:
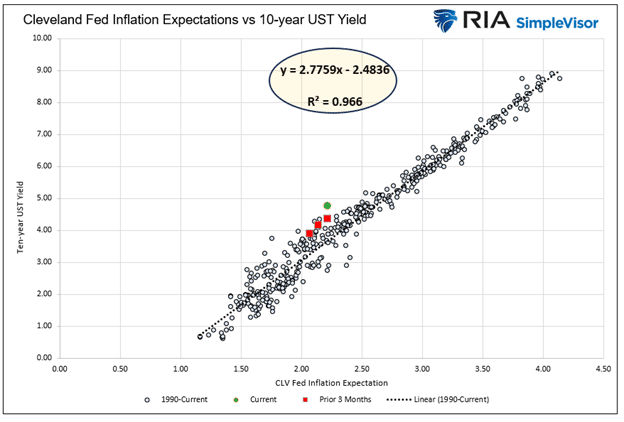
The monthly scatter plot below shows that since 1990, ten-year yields and the Cleveland Fed Inflation Expectations Index, which is also ten years, have an R-squared of .966. Simply, 97% of Treasury bond yields are explainable by the Index. As you can see, the current yield (green) lies about 1% above the trend line. Ergo, current yields are about 1% above fair value.
Suppose you think yields will rise or fall based on your inflation and economic growth forecast, or you want to create a table of various return scenarios. In that case, one can approximate returns closely by multiplying the duration of a bond with the expected change in yield. Add to that price return the expected coupon payments over an assumed period, and you have a robust estimate of potential return.
Keep It Simple, Stupid
Back to KISS. The following scatter plot comes from a recent article about Target Date Funds.
The article is from November 1, 2023. Since then, yields have fallen, and stock valuations have increased. The yields on the ten-year UST and investment grade corporate bonds are about .60% lower, while the CAPE valuation is nearly two higher. The graph is updated through early December 2023.
Each dot below shows every monthly instance of CAPE 10 stock valuations and the following ten-year stock return, including dividends, since 1881.
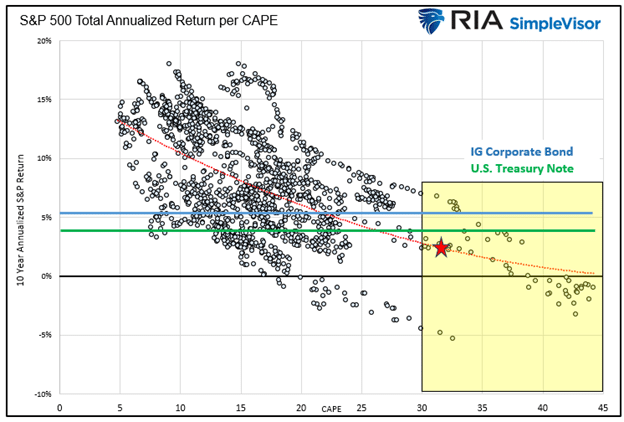
The graph highlights the likelihood that corporate and Treasury bonds will likely outperform stocks for the next ten years. Bond returns are easy to forecast. More importantly, they pay a yield equal to what may be a best-case scenario return for stocks. Why complicate matters, take the easy way, and KISS with bonds?
Summary
As shown above, stock returns over the next ten years may likely be lower than bond returns. Stock prices and valuations will change, and with it, the ten-year outlook will respond. The prospective returns for stocks and bonds may differ vastly in three months or three years. But for now, not only are bonds much easier to understand and forecast, but they also offer a comparable, if not better, return prospect.
Why not KISS with bonds and likely get paid for more doing so?
Related: US Oil Production Hits Records