
Written by: Przemysław K. Radomski, CFA
Another day, another decline in the junior miners. That’s the new reality. And with just a small push, the waterfall selling will start.
Why? For instance, because of the head-and-shoulders pattern that is about to be completed.
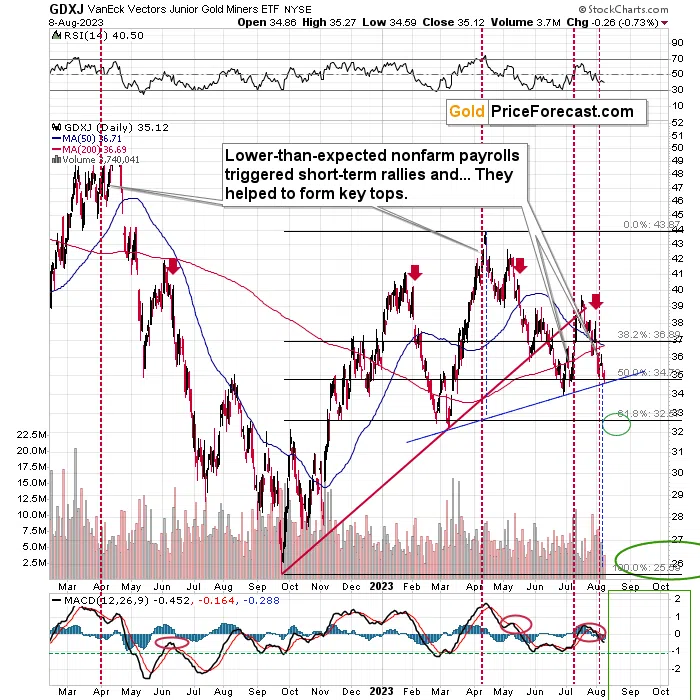
The rising, red support line was broken, and the breakdown was verified last month, so it’s already quite clear that the next big move is to the downside. There is, however, another support line (marked with blue) that is particularly important at this time.
This blue line is not important just on its own but because it’s part of a bigger pattern called “head and shoulders”. This line serves as the neck level of the pattern, and the way those patterns work is that after the breakdowns below the neck levels (once they’re verified!), the price tends to decline, and the size of the move lower is usually equal to (or greater than) the size of the head of the pattern.
I marked this with blue dashed lines. This pattern (btw, we see something analogous in the price of gold) suggests a move lower – to the $26 level, which is in tune with other techniques pointing to this as being the intermediate target level.
On a very short-term basis, we might see a correction from the previous 2023 low close to $33. Why? Because – as I wrote above – the breakdowns below the neck levels usually need to be verified by a corrective upswing – oftentimes back to the previously broken neck level.
So, a move higher from about $33 to about $35 would be quite likely from the above point of view.
Zooming in confirms this scenario even more.
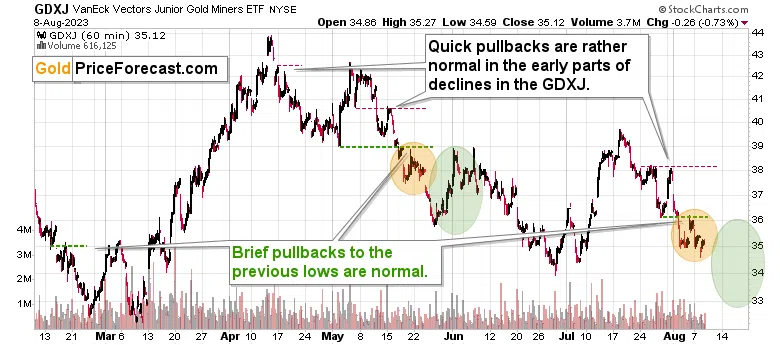
Looking at the orange ellipses immediately shows which part of the previous decline is currently being repeated. We see a consolidation that follows a move below the previous lows.
The key thing that happened in the USD Index recently is the decisive invalidation of the breakdown to new 2023 lows. This sets the USD Index up for a rally in many weeks and/or months to come.
And now we also saw a breakout above the declining green resistance line, suggesting that this time, the correction is likely brief and that the rally is likely to resume any day now.
How high can the USD Index climb before we see a bigger pause? Perhaps to its mid-year highs at about 104.5. A move to those levels would likely correspond to RSI close to the 70 level, and that’s exactly what accompanied pauses during the previous huge upswing in the USD Index – in 2021 and 2022.
So, yes, it would make perfect sense for the precious metals and mining stocks (including the GDXJ) to move lower in the near term but to take a breather soon – quite likely with the GDXJ close to the $33 level.
Naturally, that’s what appears most likely, given the data that we have available right now. Let’s keep in mind that having even the most carefully prepared research is not enough to be successful – being ready yourself is what’s needed. And a large part of being ready comes from within – from mental resilience. What good is even the most carefully crafted analysis if one gets scared when things get volatile, and the position is closed at the worst possible moment - and before becoming profitable? Perhaps, instead of the feeling of pride, causing the feelings of sadness and shame…
Related: Gold Price, USDX, and Stocks: The Winds Blow but the Mountains Stand Strong