
Another day, another drop and technical formation. Bears… What do you think about it?
Let’s start today’s analysis by quoting the last article on black gold:
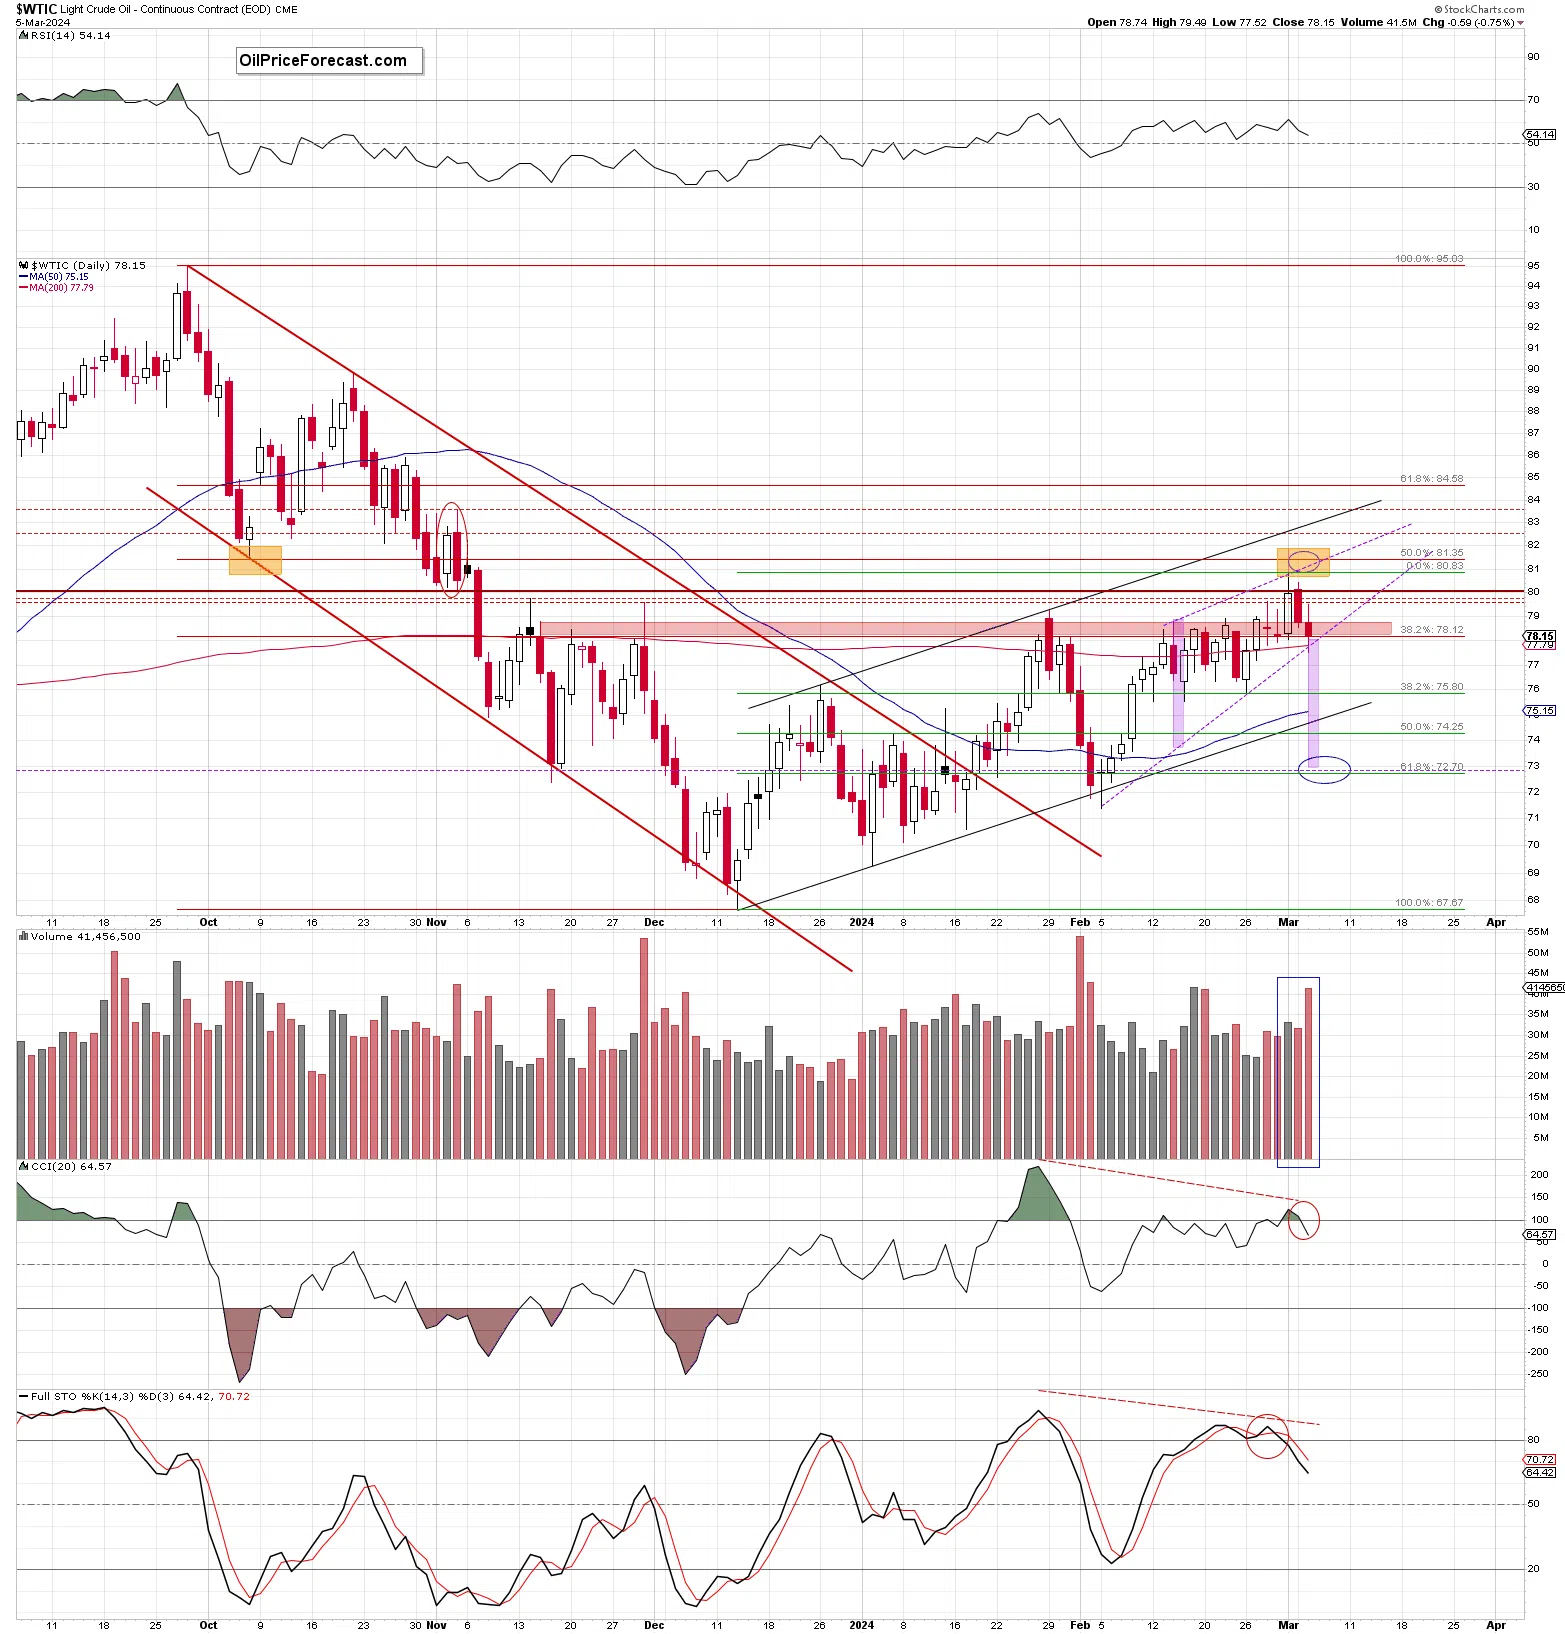
(…) black gold closed Monday’s session not only under the barrier of $80, but also below the previously broken upper border of the blue rising channel.
In this way, light crude invalidated the earlier breakout, which doesn’t look bode well for the bulls – especially when we factor in the fact that thanks to yesterday’s price action, the beard gained four important allies: another daily closure under the barrier of $80, the above-mentioned invalidation of the breakout, an invalidation of the breakout above the Jan.29 peak and the pro-declining candlestick formation (dark cloud cover) marked with the red ellipse.
(…) all the above-mentioned technical factors combined with the current position of the indicators suggest that further deterioration may be just around the corner.
What could happen if this is actually the case and crude oil extends losses from here?
(…) yesterday’s drop invalidated the breakout above the previously broken red zone, which suggests that we could see a decline to at least the 200-day moving average and the lower border of the purple rising wedge in the coming days.
From today’s point of view, we see that the situation developed in accordance with the pro-declining scenario, and the bears reached the above-mentioned first target during yesterday’s session.
But what happened before they got here? Let’s take a look at the chart below.
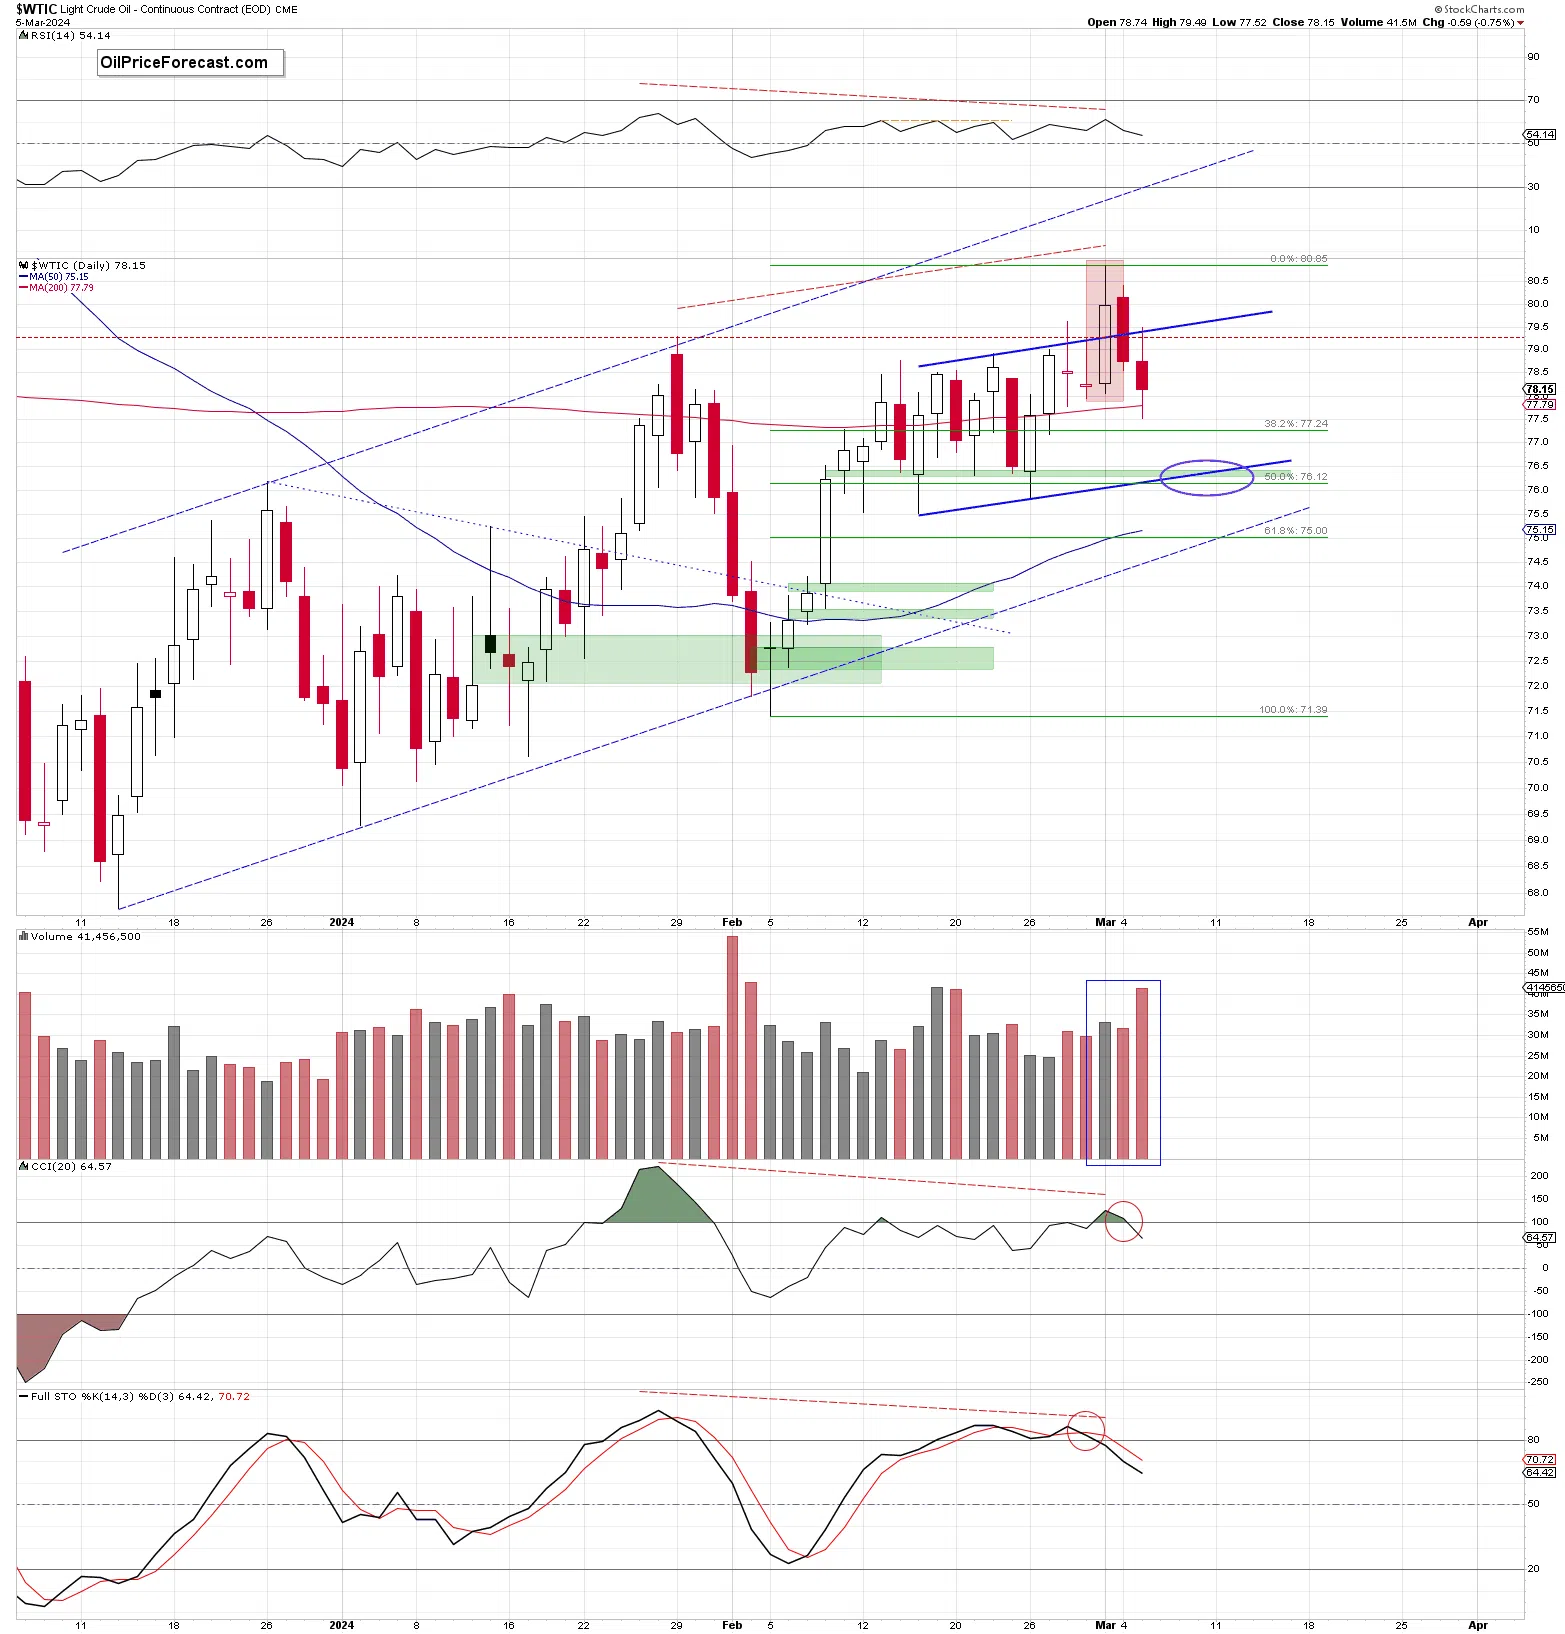
Looking at the daily chart, we see that the commodity started yesterday’s session at the Monday’s closing price (not lower), which encouraged the bulls to go higher. Thanks to their action light crude climbed to $79.49 but didn’t manage to reach the barrier of $80 as the previously broken upper border of the blue channel stopped the buyers.
This show of weakness triggered the bears and caused a pullback, which took the price of black gold under the opening price. Just like in all previous cases such price action accelerated the decline and pushed the commodity not only below Monday’s low, but also slightly below the 200-day moving average and the lower border of the purple rising wedge (marked on the first chart). In this way, light crude reached the first downside target described in yesterday’s Oil Trading Alert.
The combination of these strong supports mobilized the buyers to close ranks and take action.
As a result, the price rebounded and finished the day above both supports, invalidating the earlier tiny breakdown. This is a positive development, which suggests that the bulls may want to go even higher during today’s session and regain at least some of the lost points.
If this is the case, we could see a move even to around $79.60, where the 61.8% Fibonacci retracement (based on the recent declines) currently is. In this way, light crude could re-test the strength of the mentioned earlier upper border of the blue trend channel and check if oil bears still have an appetite for lower prices.
If they manage to fend off the bulls once again and keep their recent allies in power, the chance of further southward movement increases significantly - especially if we take into account the sell signals generated by the daily indicators.
Summing up, crude oil slipped to the 200-day moving average and the lower border of the rising wedge during yesterday’s session, but the combination of these strong supports withstood the selling pressure and triggered a rebound before the session closure. In this way, light crude invalidated the earlier tiny breakdown, which could translate into a rebound during today’s session (at least at the beginning of the trading day).