
In Our Elevator Pitch For Bonds, we ask, “is this time different.”
Our view of the attractiveness of bonds can be honed into an elevator pitch. It essentially boils down to a straightforward question – Is this time different?
Have the forty-year pre-pandemic economic trends reversed, and the economy’s inner workings changed permanently over the last three years? expectations
More specifically, are slowing productivity growth, weakening demographics, and rising debt levels about to reverse their prior trends and become a tailwind for economic growth?
NO, this time is not different. Yesterday’s economic headwinds have not vanished. They will eventually overcome the massive pandemic-related stimulus that continues to prop up the economy.
This article employs a classic bond model that allows us to solve for the expected economic growth as implied by bond yields. As you will see, the bond market believes economic growth will be significantly higher than expectations for the last 20 years. If they are correct and this time is different, current bond yields may be fair or even too low. However, if this time is not different, the market is grossly offside in its growth expectations, and bond yields are too high.
Decomposing Bond Yields
U.S. Treasury bond yields are a function of three factors: term premium, inflation, and economic growth expectations. Because Treasury securities are considered risk-free, credit risk is not a factor. For more on that, please read our recent article, Risk Free Government Debt- Fact Or Fiction.
Term Premia
Term premium, also called term premia, is the amount by which the yield of a long-term bond exceeds the expected yields of short-term bonds. It quantifies the amount investors expect to be compensated for committing to one long-term interest rate versus a series of shorter-term interest rates.
Term premia is not an exact science, but there are many models that calculate it, including the Fed’s Three-Factor Nominal Term Structure Model. We use this model to decompose yields later in this article.
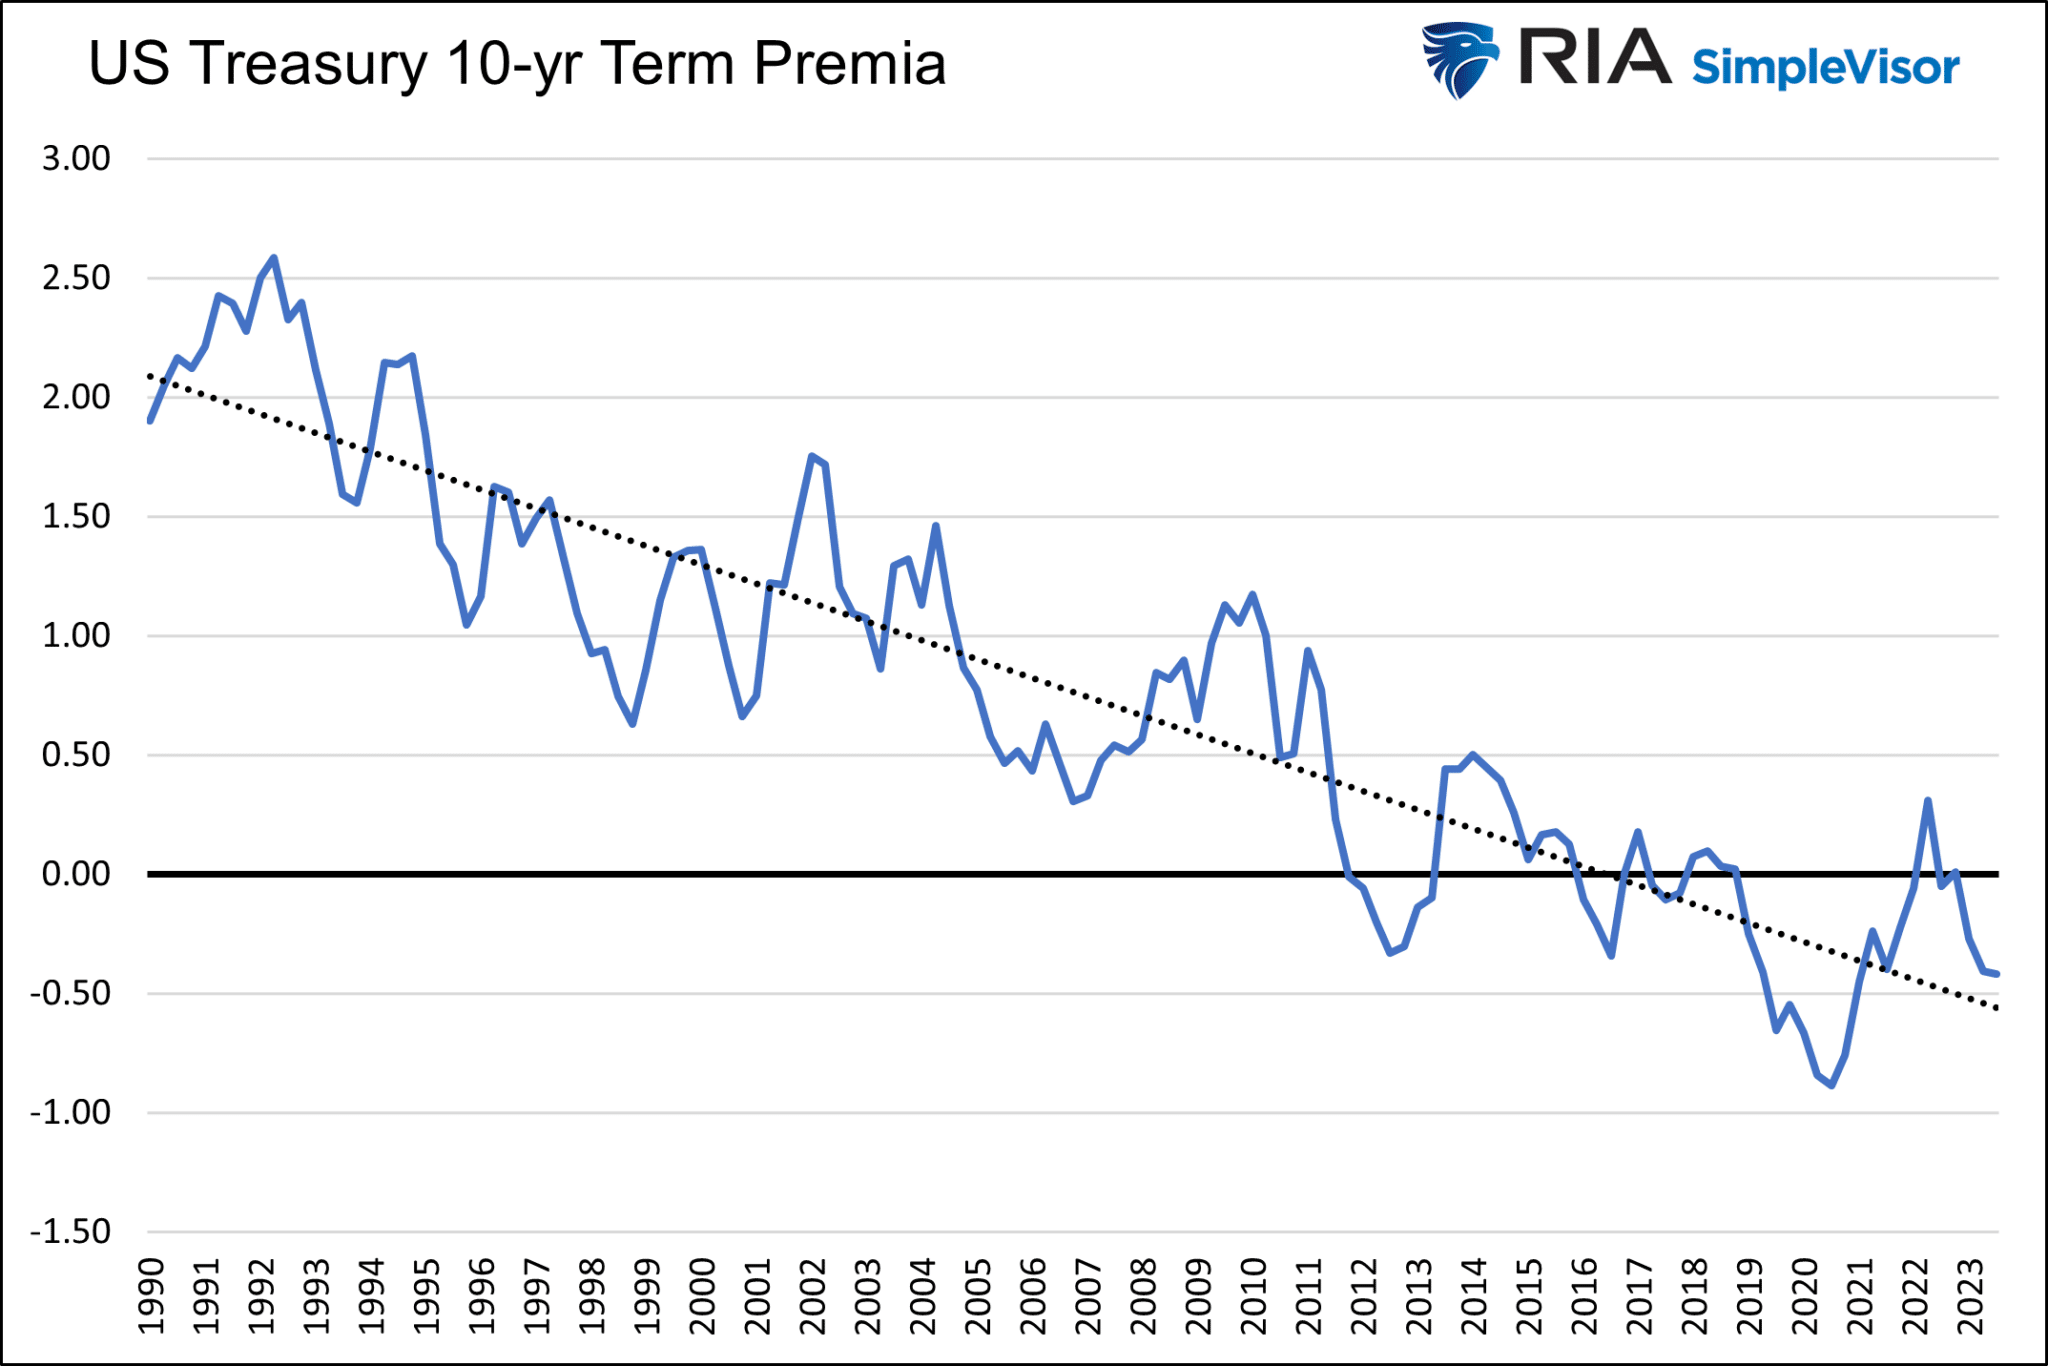
The Fed model, graphed below, shows a steady decline in the term premium for the last 30+ years. Since rates have been reliably trending lower, long-term bond investors have been increasingly willing to accept less of a term premium because they expect short-term yields to continue to trend lower. As shown, the premium has primarily morphed into a discount since 2018. Such indicates that a series of short-term rates over the next ten years will average less than current long-term rates.
Inflation Expectations
Gauging inflation expectations is done via numerous surveys of consumers and business leaders. They can also be calculated through the difference between TIP and nominal bond yields. Further, the Fed updates its outlook for longer-term inflation rates quarterly.
This analysis uses the difference between TIPs and nominal bonds, known as the breakeven inflation rate. Unlike surveys and Fed estimates, the breakeven rate is based on investors and traders putting their money where their mouths are. Thus, we might claim it to be a little more credible.
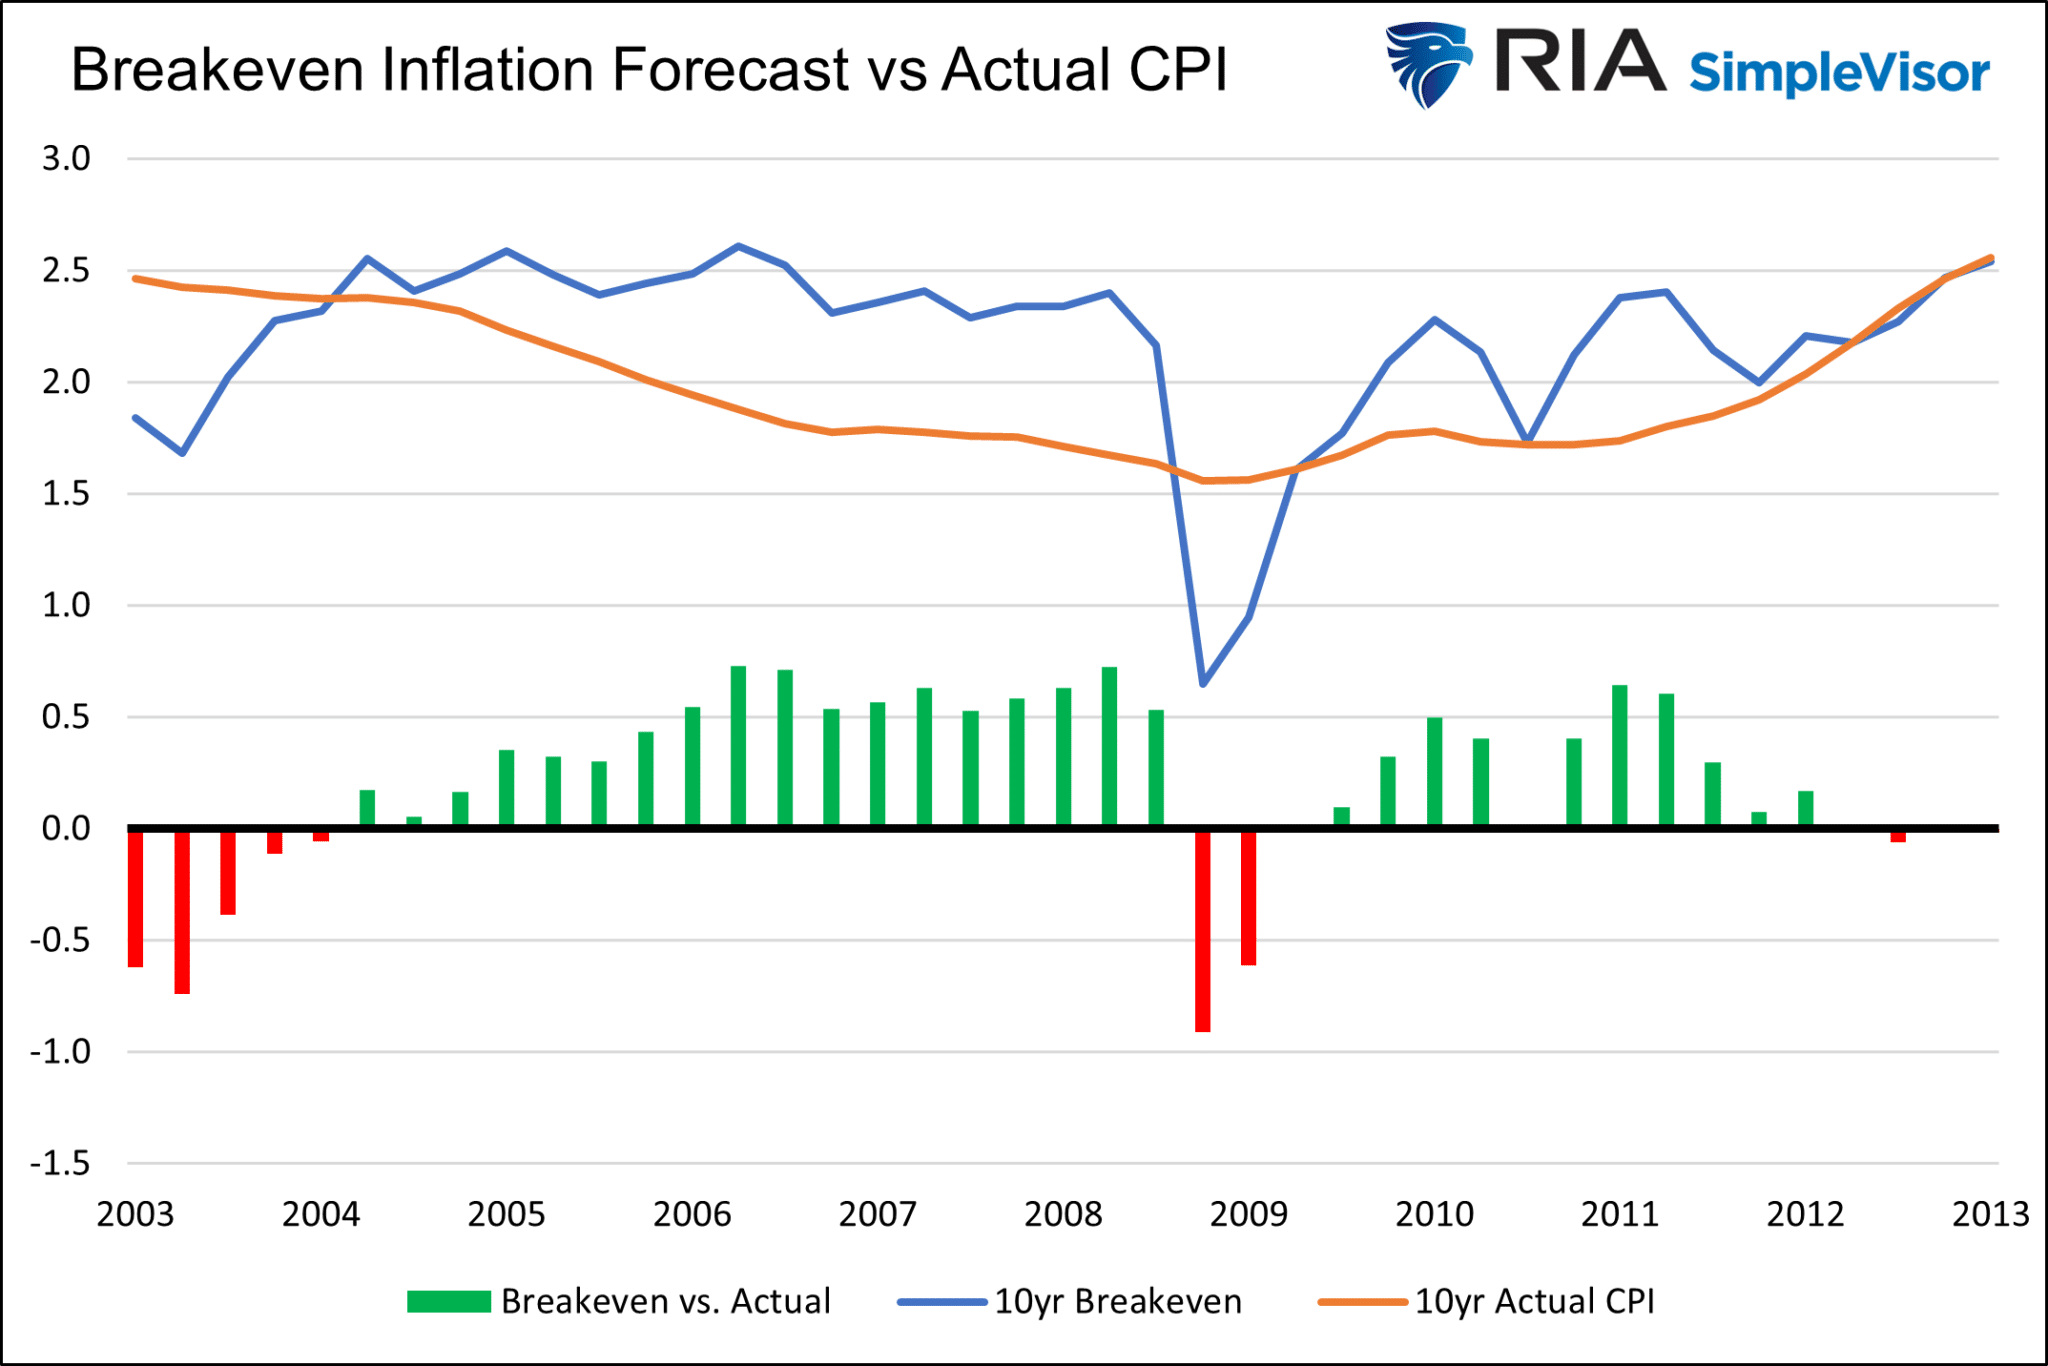
The following graph shows the long-term trend in 10-year inflation expectations and the actual rate of inflation that followed in the subsequent ten years. Other than during recessions, the market tends to overestimate future inflation rates by a quarter to half a percent. The chart ends in 2013, as we do not have ten full years of future inflation data after that year.
Economic Growth Expectations
The third factor is economic growth expectations. Like inflation expectations, there are many sources for this data.
To put context to our opening question, “Is this time different?” we solve for economic growth expectations using the Fed term premia model and ten-year breakeven inflation rates.
Before we look at expectations, let’s look at the historical economic growth trend.
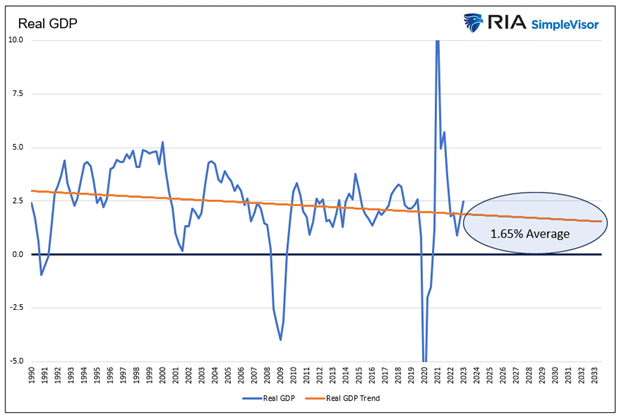
As shown, real GDP has been trending lower since 1990. Assuming the trend holds, real GDP will average 1.65% over the next ten years. The trend currently resides at 1.90%.
Decomposing Bond Yields
The following graph uses the current ten-year yield and decomposes the rate based on term premia, inflation expectations, and the implied economic growth rate we solve for.
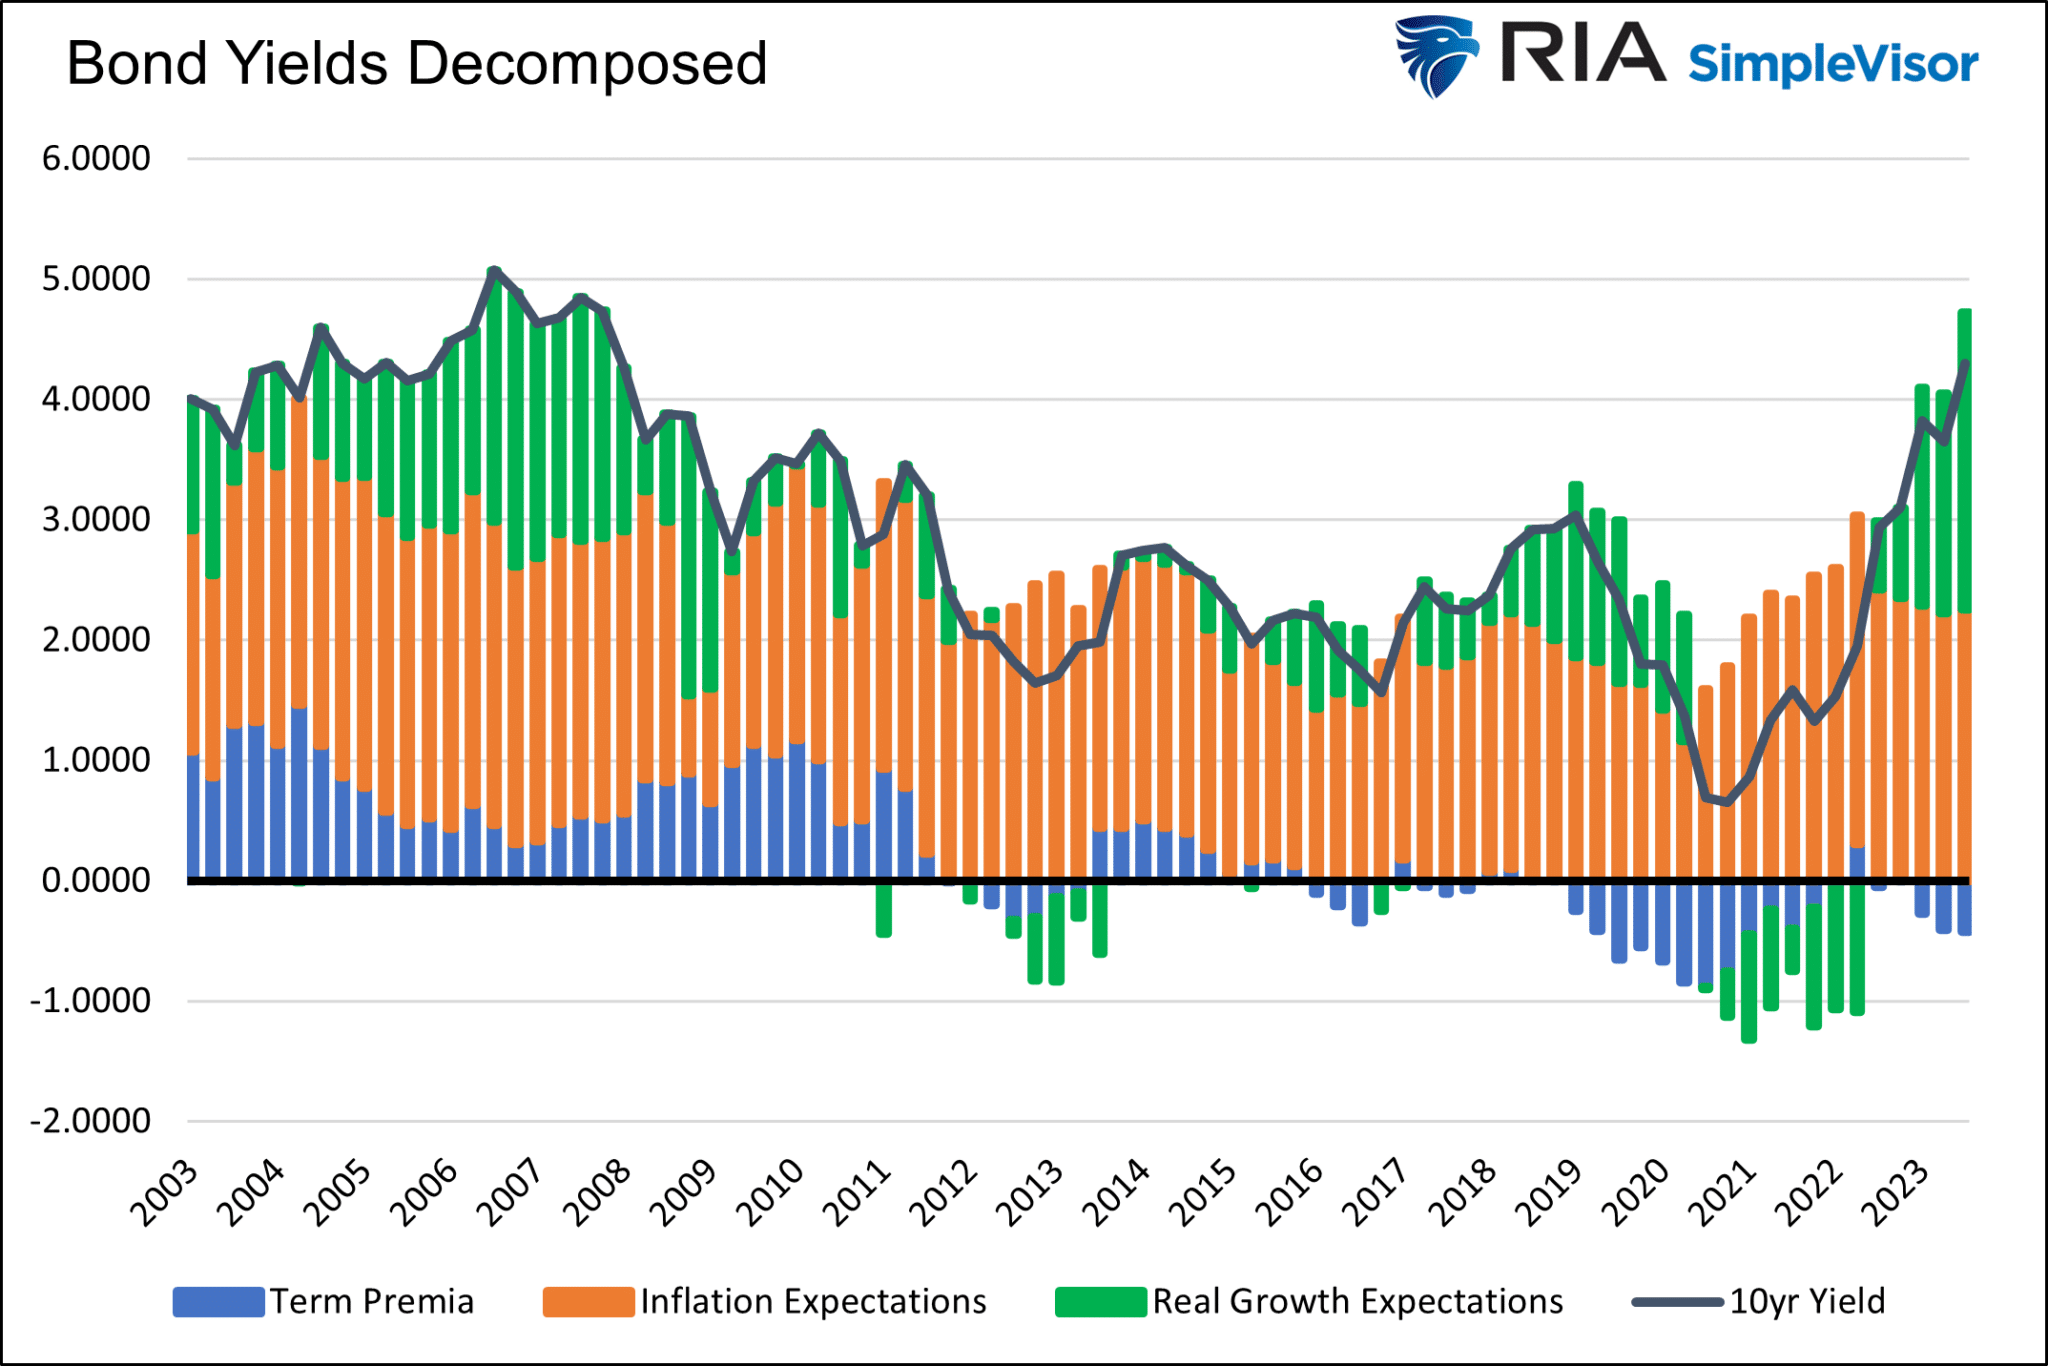
The following chart singles out real growth expectations (green above), which we solved for.

Bond yields imply the highest economic growth rate in the last 20 years!
The next graph allows us to compare growth expectations, as shown above, to the trend growth rate over the 20-year period.
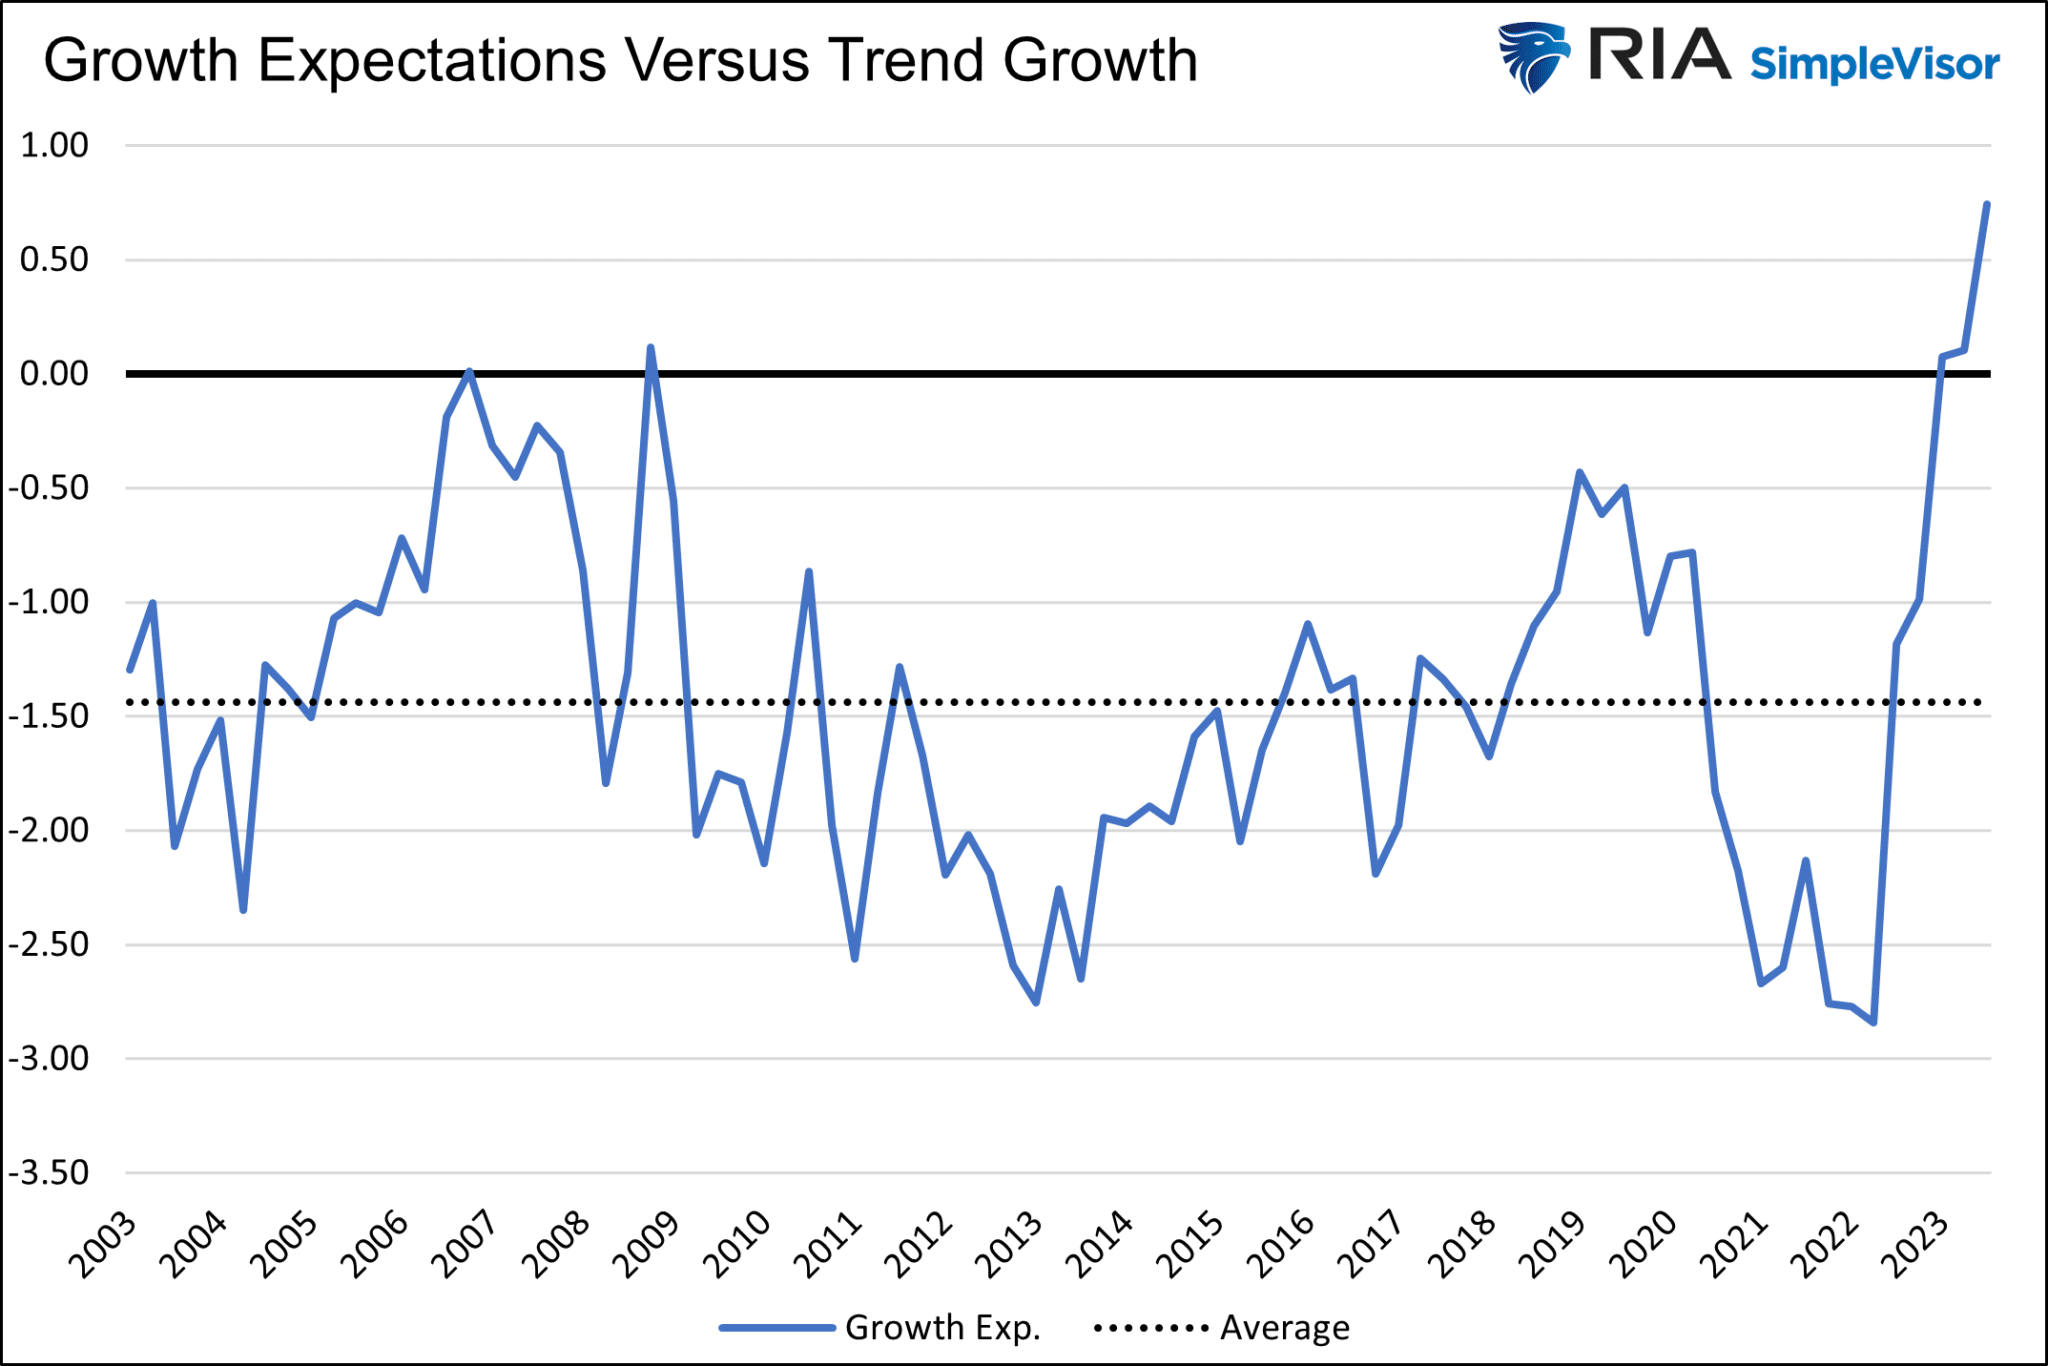
The last time the bond market implied such a high forecast for economic growth was around the financial crisis and recession of 2008-2009. However, real GDP was trending 0.5% higher during that period than today. On a relative basis, the current expectation is .75% higher.
Our analysis assumes the Fed’s term premia and the market’s 10-year breakeven inflation estimates are correct. They are not, nor will they be accurate in the future. As a result, growth expectations, as we solve for, have been about 1.50% short of reality.
However, context is essential. While the growth estimate will likely be too low, the current deviation versus prior readings is what matters. Currently, yields imply almost 2.50% more growth than its average forecast for the last 20 years.
Summary
The bond market implies something has changed in the last couple of years to reverse the nation’s downward economic growth trajectory. There is nothing that leads us to that conclusion.
The pandemic only aggravated the debt burden, which reduces future growth rates. Demographics continue to worsen slowly, detracting from economic growth. Given debt, demographics, and other social and political factors, we see no reason productivity growth won’t continue to decline, which also weighs on economic growth.
Can AI be a productivity game changer and rationale for higher economic growth rates? Maybe, but productivity growth has declined over the last 25 years despite the internet, robotics, and numerous other productivity-enhancing inventions.
Can the economy grow 2.0% to 2.5% faster per year over the next ten years than the last 30 years? We don’t think so. Therefore, the graphs suggest ten-year yields are about 2.0% to 2.5% too high.
This time is not different, and bond yields are too high.
Related: The Lag Effect Unveiled