
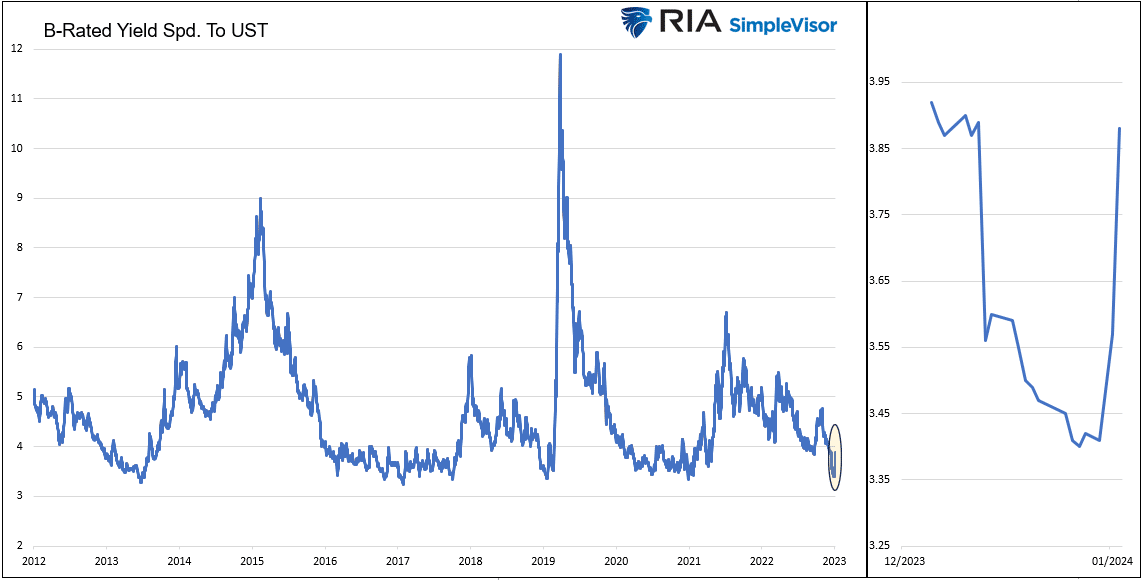
“U.S. (corporate) high-yield bonds have sold off at the fastest pace since March, when traders were worried about a banking market collapse. Spreads have widened by nearly half a percentage point since Dec. 28, the fastest pace since March 16“- Lisa Abramowicz- Bloomberg. The yield spread, or differential, between junk-rated corporate bonds and U.S. Treasuries is a reliable signal of the economy’s health. Corporate junk bond issuers are risky propositions for investors. Accordingly, recessions often lead to a surge in default rates for such companies. Therefore, when bond investors worry about the economy, junk bond yields increase versus Treasury yields. Lisa Abramowicz alludes that junk bond market investors may be concerned about the economy or banking crisis.
Despite numerous omens that have traditionally signaled a recession is coming, the junk bond market has yet to provide such a warning. The graph below shows that, until very recently, B-rated corporate bonds were trading at their lowest spread to Treasuries in at least ten years. We magnify the recent activity to the right. As Lisa notes, the 50 basis point increase has been fast. However, yield spreads fell rapidly as the stock market rallied in December. Like the stock market, the recent activity in spreads is likely a hangover from pre-new-year trading activities. That said, if the spike in yields continues, something more ominous may lurk.
What To Watch Today
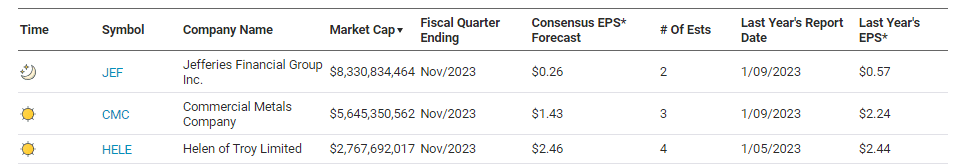
Earnings
Economy
- No notable economic data releases today
Investing Summit: Early Bird Registration Available Now
January 27th, we are hosting a live event featuring Greg Valliere to discuss investing in the 2024 presidential election. What will a new president mean for the markets, the risks, and where to invest through it all? Greg will be joined by Lance Roberts, Michael Lebowitz, and Adam Taggart for morning presentations covering everything you need to know for the New Year.
Register now, as there are only 150 seats. The session is a LIVE EVENT, and no recordings will be provided.
Market Trading Update
In our last newsletter for 2023, we noted that the more overbought conditions of the market were a risk. To wit:
“While the price action this past week reduced some of the overbought conditions, as represented by the Relative Strength Index (RSI), more work is still ahead. Next week, the ‘Santa Claus Rally’ will officially begin, lasting through the first two days of January. Given the overbought condition, further upside may remain limited.”
As noted yesterday, the beginning of 2024 has so far started with a sell-off that wiped out all of the gains from the last five days of December. In other words, “Santa Failed To Visit Broad And Wall.”
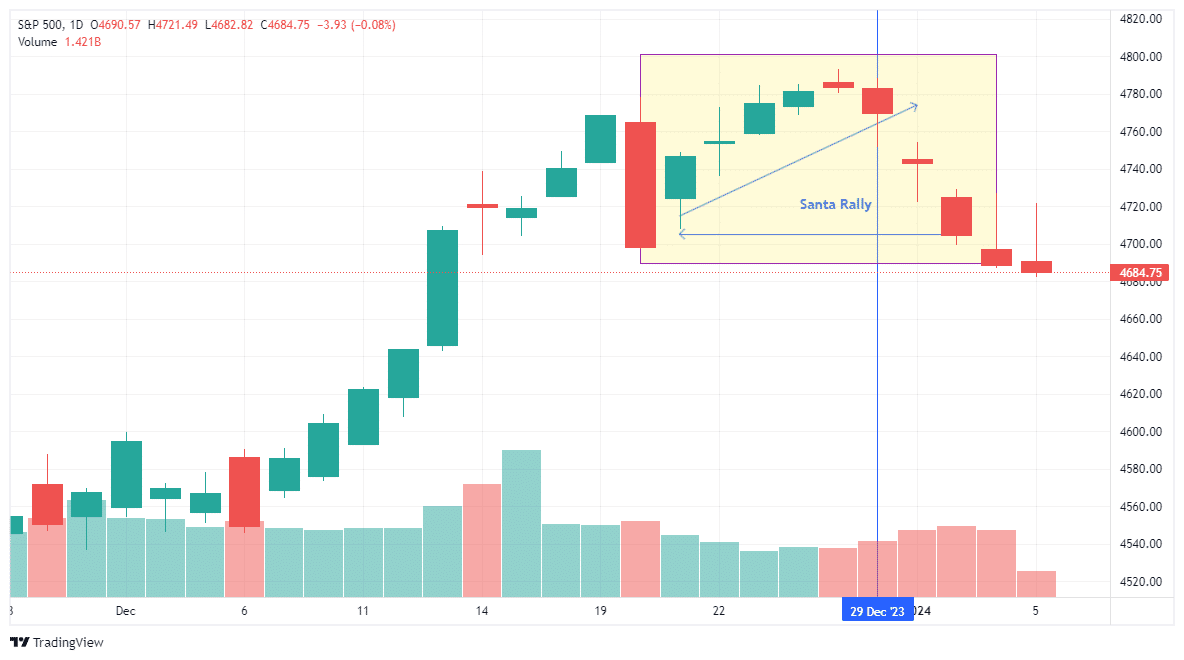
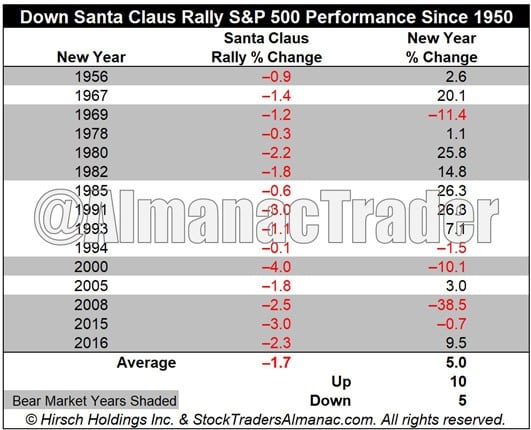
The failure of the Santa Claus rally has some historical implications, but not as dire as many have come to believe. As noted by the Stocktraders Alamanc on Wednesday:
“On the heels of last year’s momentous rally, the market is showing some signs of weakness causing the Santa Claus Rally to fail to materialize. Profit taking in January has become more commonplace in the last 25 years or so and January is notably softer in election years like 2024. Some profit taking is understandable following the massive rally from the end of October ranging from just over 16% for DJIA and S&P 500 to 19.9% for NASDAQ and 26.2% for Russell 2000 at their respective recent highs just before yearend. But the selling over the past few days is notable and a warning sign.
The lack of a rally can be a preliminary indicator of tough times to come. This was certainly the case in 2008 and 2000. A 4.0% decline in 2000 foreshadowed the bursting of the tech bubble and a 2.5% loss in 2008 preceded the second worst bear market in history. Down SCRs were followed by flat years in 1994, 2005 and 2015, and a mild bear that ended in February 2016. Of the 15 down SCRs since 1950, 10 years have been up and 5 down, but the average gain is a measly 5.0%. As Yale Hirsch’s now famous line states, ‘If Santa Claus should fail to call, bears may come to Broad and Wall.'”
With the Santa Claus Rally, a no-show, we will now focus on the return for the first five days and for the entire month. The old Wall Street axiom says, “So goes the first 5 days of January, so goes the month, so goes the year.” Since 1950, there have been only three occurrences when the Santa Rally failed, and the first 5 days and the month of January were positive. Two out of three of those years were up over 20%, and 1994 was flat, at -1.5%. The average gain for those 3-years was 14.8%.
With Friday’s close, we will need one “helluva” rally before today’s close to reach a positive first five days.
The Week Ahead
CPI, PPI, and corporate earnings are on the docket this week. Core CPI is expected to rise 0.2%, bringing the year-over-year rate to 3.9%. Core PPI is expected to rise 0.1%, putting the year-over-year rate at 2.0%. Assuming the consensus is correct, the Fed should remain comforted that inflationary pressures continue to ease. Given the red flags in last week’s employment report, Thursday’s initial jobless claims data will likely be followed closely for real-time employment signals.
Q4 earnings season starts in earnest, with some of the largest banks reporting on Friday. UNH, a new holding of ours, will also report Friday.
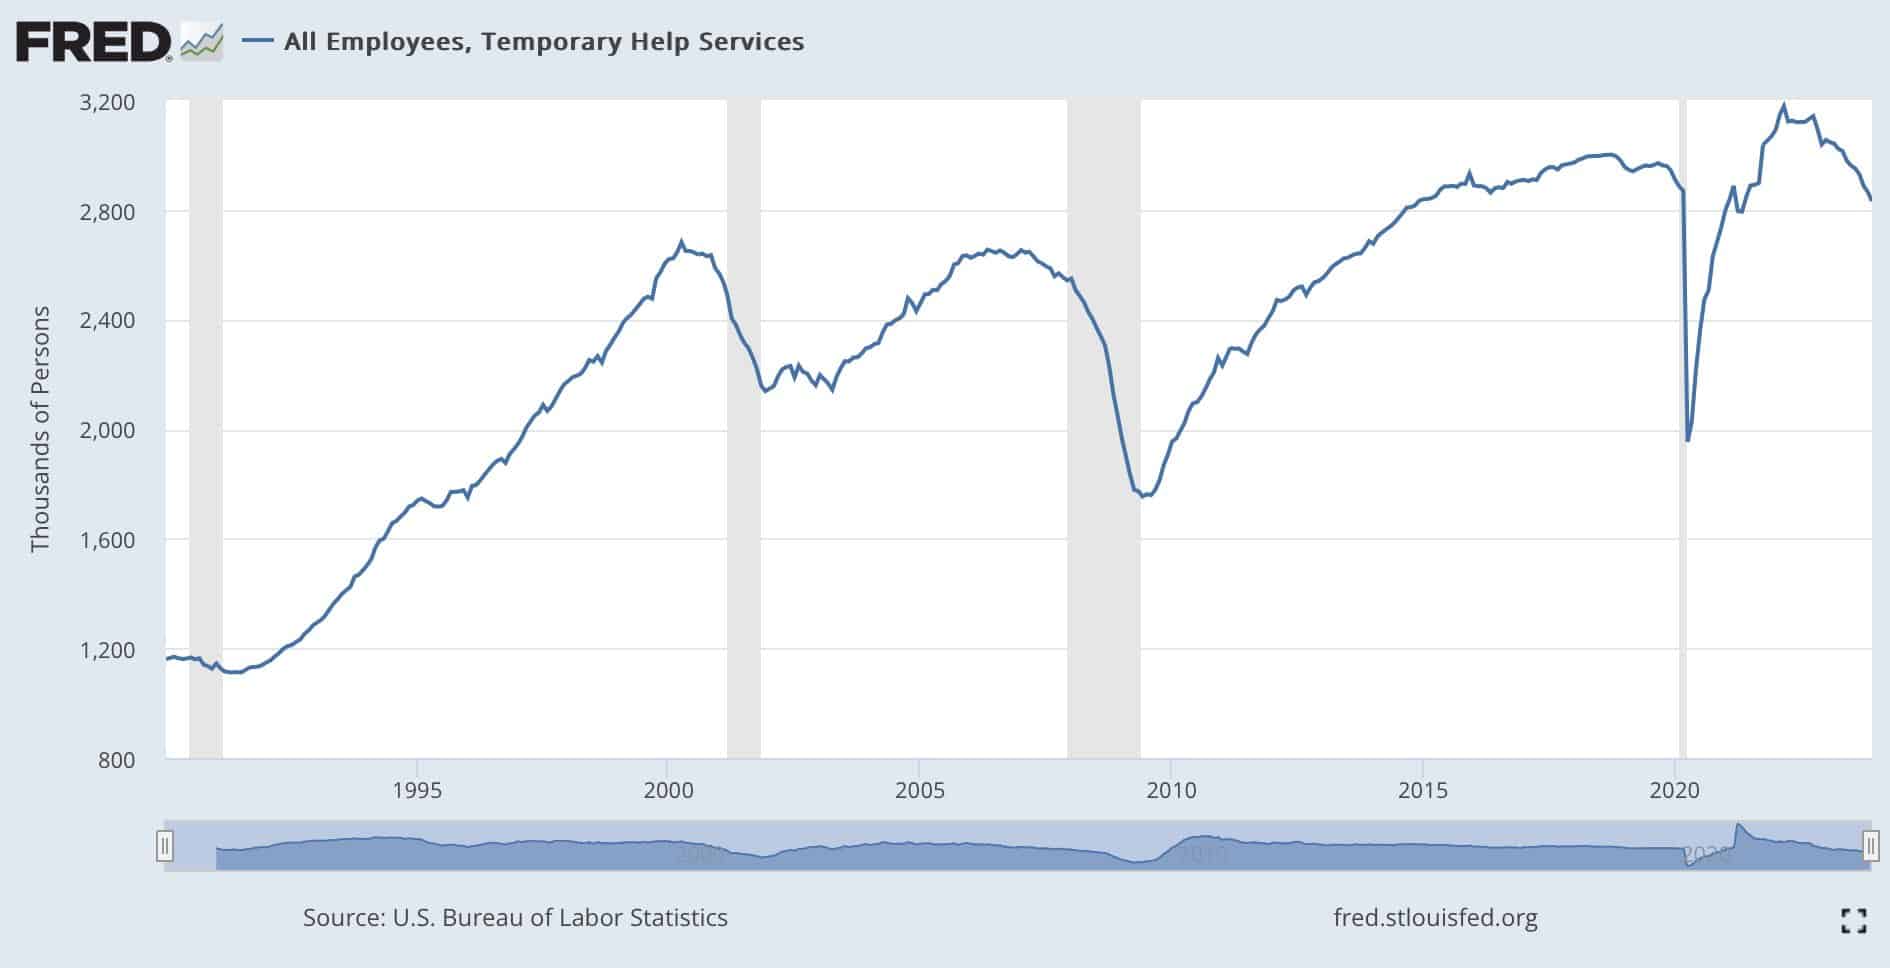
The Labor Market Remains Strong But….
The BLS monthly labor report was stronger than expected at 216k new jobs versus expectations of 175k. Hourly earnings were also a tenth of a percent higher than expectations, and unemployment was a tenth of a percent below expectations. The report continues to highlight that the labor markets are in good shape.
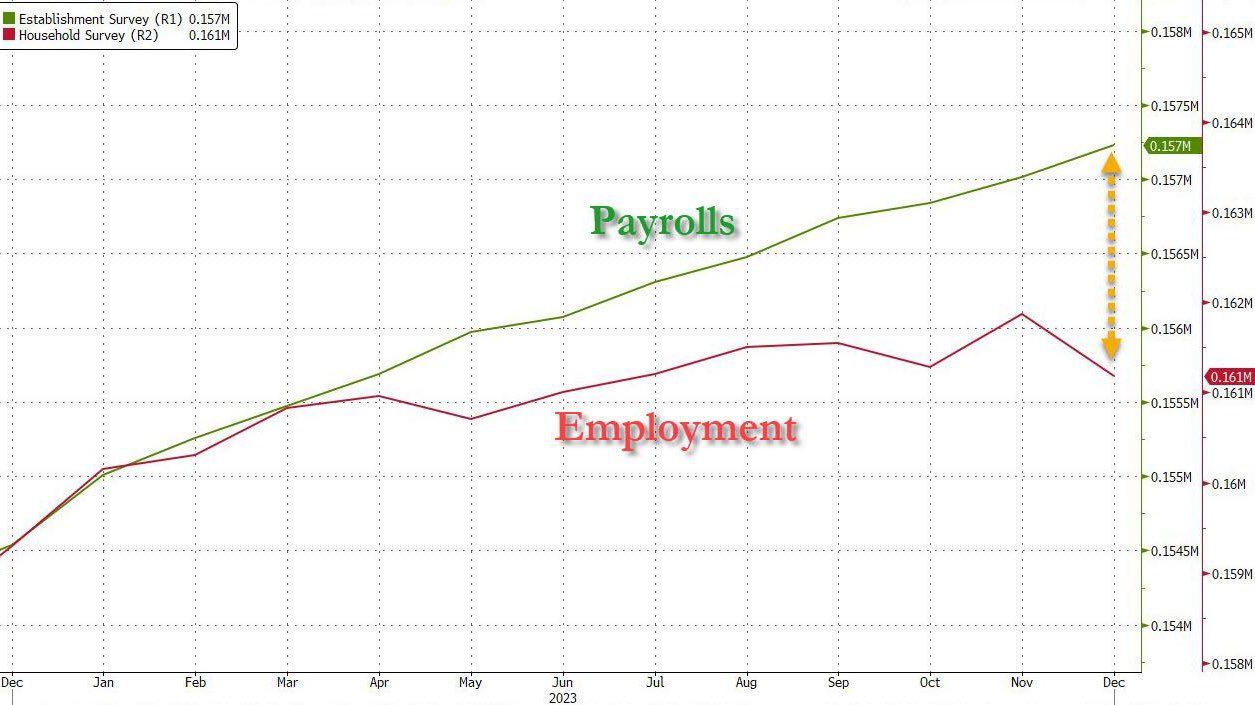
However, there are some red flags within the report. First, as shown below, temporary help service employees, often a good leading employment indicator, continue to decline and are moderately below pre-pandemic levels. Second, the labor participation rate fell from 62.8% to 62.5%. Such was the largest drop in three years. If the labor market is so good, why are workers leaving the workforce? We should see the participation rate rise. Lastly, the household survey used to compute the unemployment rate saw the number of employed fall by 683k. The declining participation rate is why the unemployment rate fell, not rose, despite the decline in employment. The second graph below shows that the household and establishment surveys continue to diverge. Based on the household surveys, the number of employed has been unchanged since July. Yet corporations show continued growth over the same period.
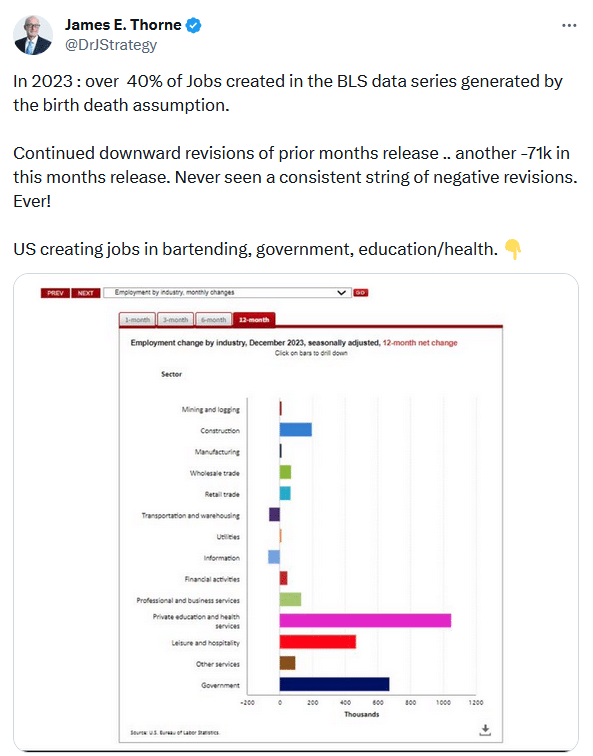
Today’s Tweet of the Day leaves you with a few more employment red flags to ponder.
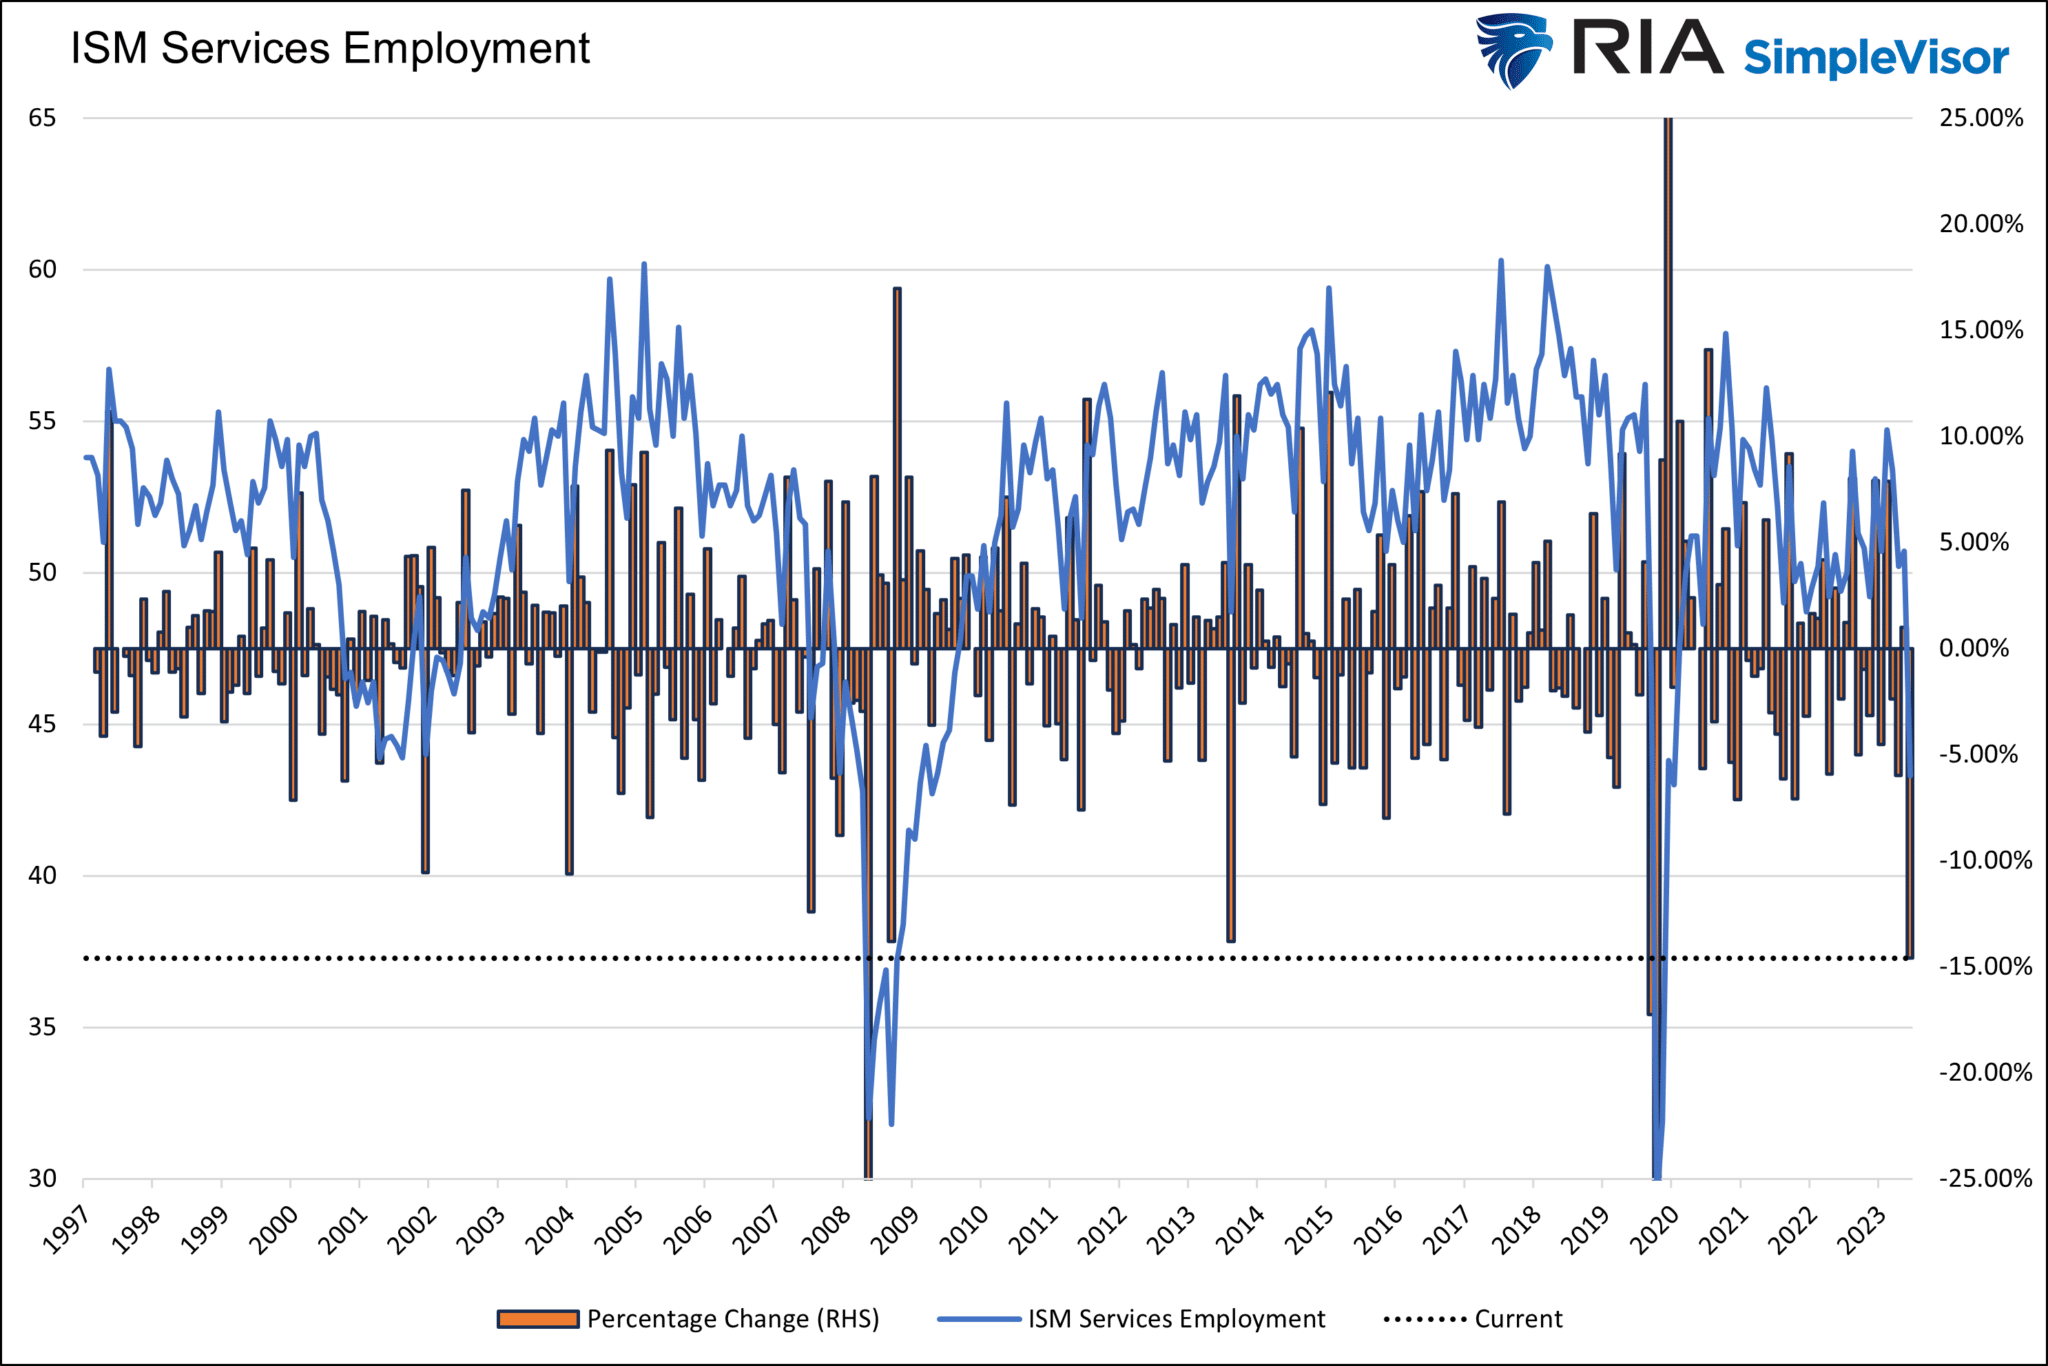
Another But… In The Labor Markets
The services sectors have driven economic growth, with the manufacturing sector in a recession for the last two years. Friday’s ISM Services data gives us pause that the service sectors may be starting to experience weakness. ISM Services was 50.6, two points below expectations and last month’s number. The graph below is of much more importance. The employment sub-index plummeted from 50.7 to 43.3. As shown, the percentage decline is the largest outside of the 2008 financial crisis and the initial months of COVID. Since 1997, the average change in the index is about 1.5 points. It fell over 7 points last Friday!
ISM data is considered more real-time than that of the BLS. As such, is the sharp decline in employment a seasonal blip, or did something happen in the economy over the last few weeks? Stay tuned to weekly initial jobless claims to help better decipher the situation.
Tweet of the Day
“Want to have better long-term success in managing your portfolio? Here are our 15-trading rules for managing market risks.”