
In 2013, I wrote an article discussing comments made by Russ Koesterich, CFA, regarding the Chicago Fed National Activity Index (CFNAI). Given this economic indicator just crashed by the most on record, it is worth reviewing his comments. To wit:
“While economic numbers like GDP or payroll reports garner the headlines, the most useful statistic often goes ignored by investors and the press.”
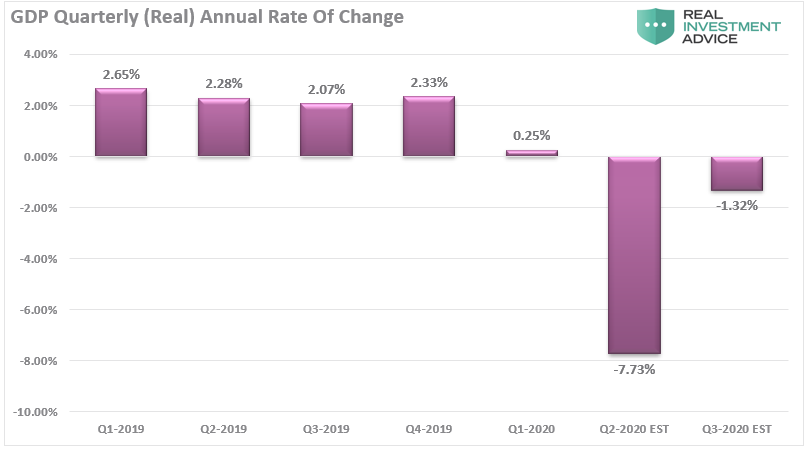
On Thursday, the Bureau of economic analysis released revisions to the GDP report for the first quarter of 2020. It fell from a 2.3% annual real growth rate in the 4th quarter of 2019 to a -5% rate in the first.

Importantly, the decline in the first quarter only encompassed 2-weeks of the economic shutdown. Considering the entire month of April was a “bust,” we already have a good idea Q2-2020 GDP will be substantially worse.
To gauge just how bad it will be, we could look at the New York or Atlanta Federal Reserve’s real-time GDP trackers. We are currently tracking more than a 30% decline in the second quarter, which is where we derived the estimate in the chart above.
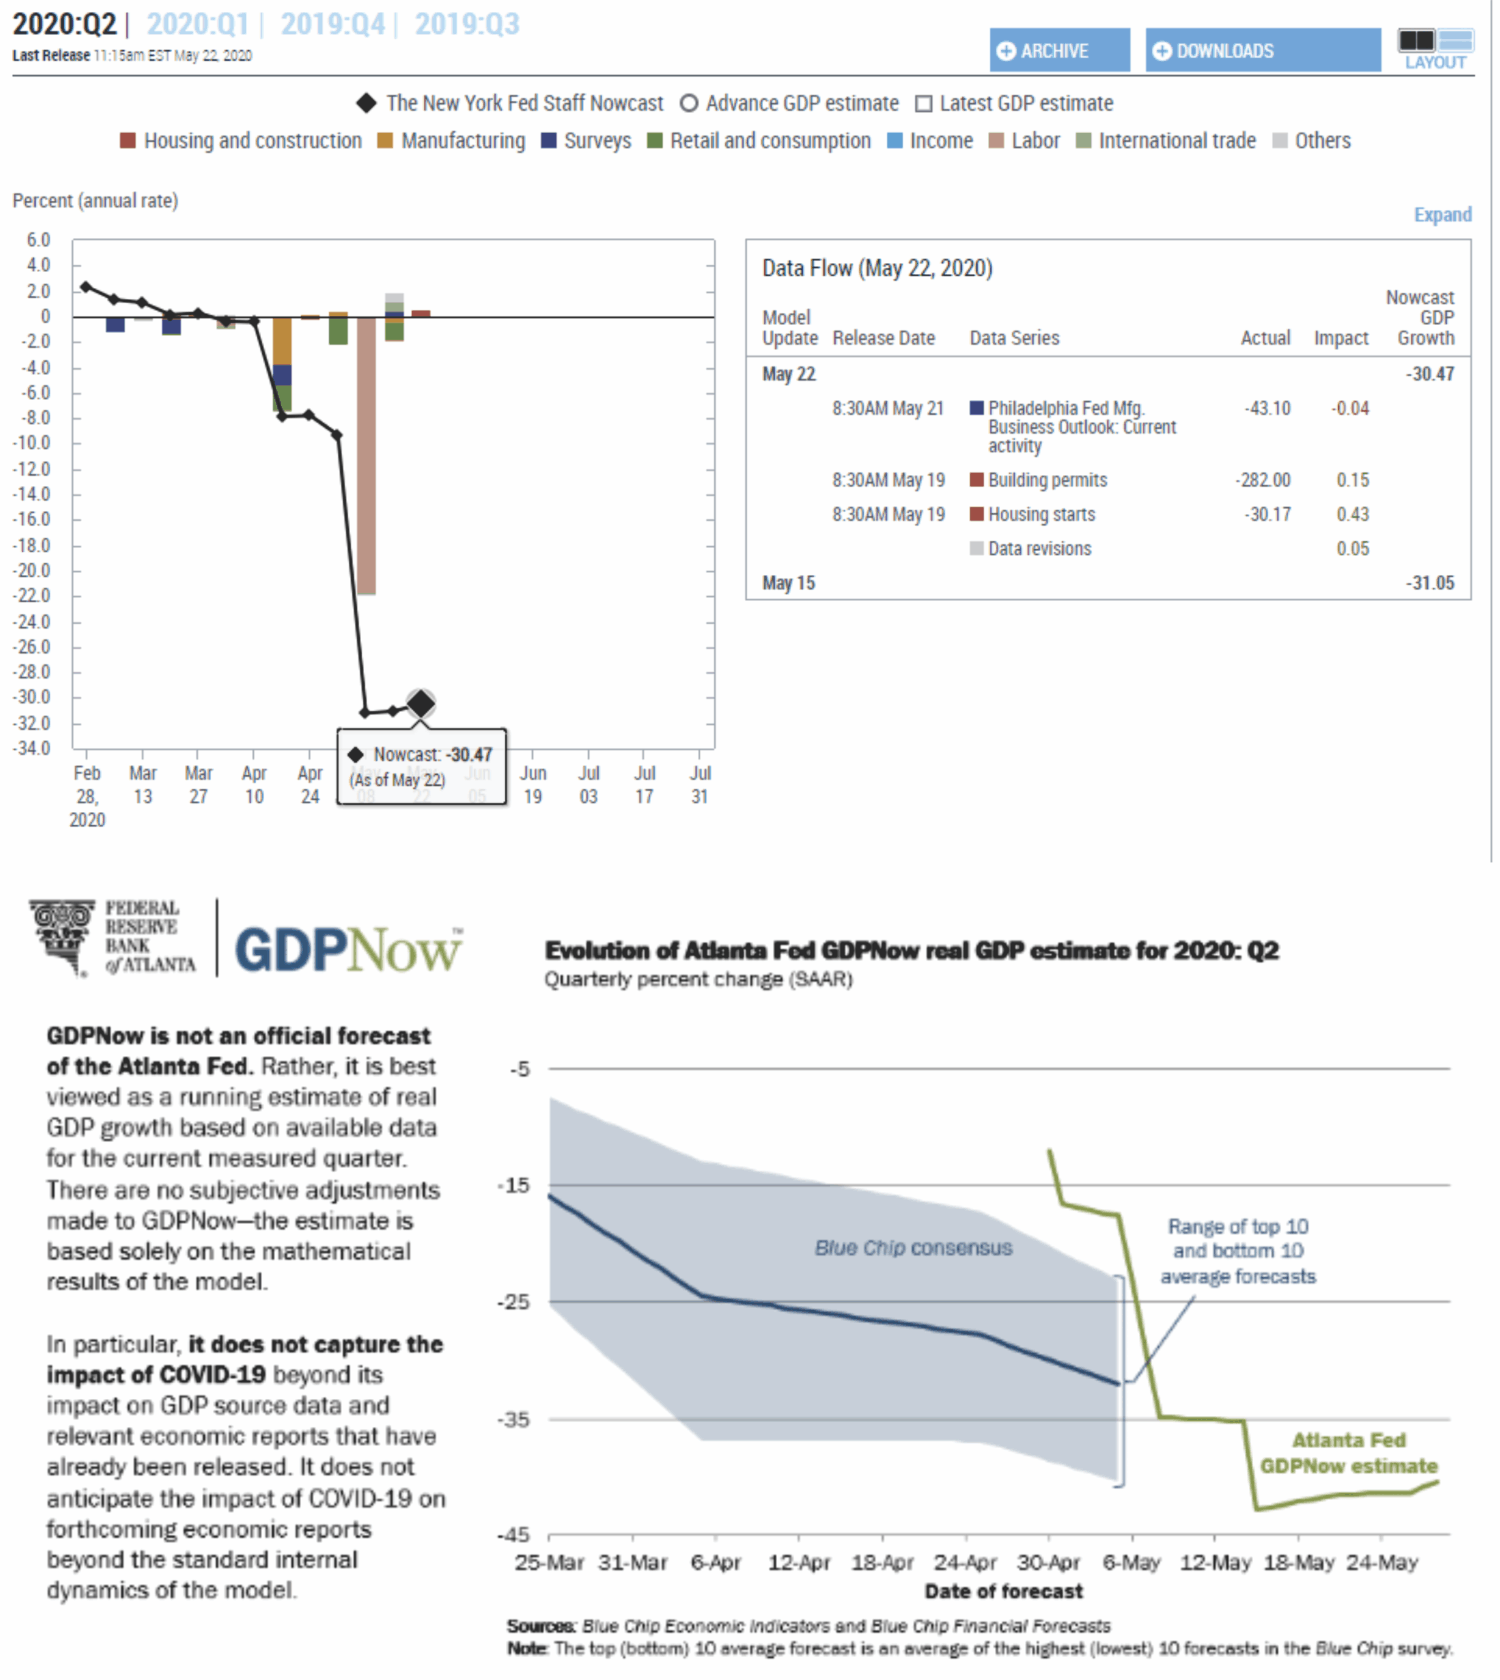
Regardless, we are discussing unprecedented numbers going back to 1947 when the tracking of the data began.
A Better Measure
As noted, the Chicago Fed National Activity Index (CFNAI) often goes ignored by investors and the press. Importantly, the CFNAI is a composite index made up of 85 sub-components, which gives a broad overview of overall economic activity in the U.S.
The markets have run up sharply over the last couple of months because the Federal Reserve intervened again in the markets. The hopes are the record plunge in GDP in Q2 will be reversed with a record surge in Q3. However, a 30% decline in GDP, followed by a 30% advance, does not get you out of a recession. (A 30% recovery number is wildly optimistic, most likely we will see a 15-20% increase)
If recent CFNAI readings are any indication, investors may want to alter their growth assumptions for next year. Most economic data points are backward-looking statistics, like GDP itself. However, the CFNAI is a forward-looking metric providing some indication of how the economy will look in the coming months.
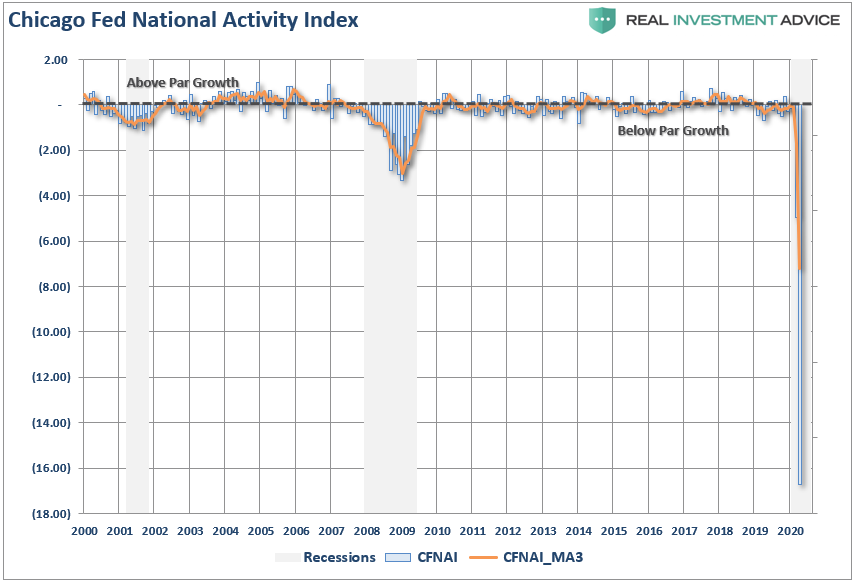
If the CFNAI is currently even close to historical accuracy, current expectations are likely overly optimistic.
Breaking CFNAI Down
To garner a better understanding of the index, let’s dig into its construction. From the Chicago Fed website:
“The CFNAI is a monthly index designed to gauge overall economic activity and related inflationary pressure. A zero value for the index indicates the national economy is expanding at its historical trend rate of growth. A negative value indicate below-average growth, and positive values indicate above-average growth.“
The overall index is broken down into four major sub-categories which cover:
- Production & Income
- Employment, Unemployment & Hours
- Personal Consumption & Housing
- Sales, Orders & Inventories
To better grasp these four major sub-components and the predictive capability, I have constructed a 4-panel chart. The chart compares each sub-component to the most common matching economic reports on an annualized basis.
- Industrial Production
- Employment
- Housing Starts
- Personal Consumption Expenditures. (70% of GDP)
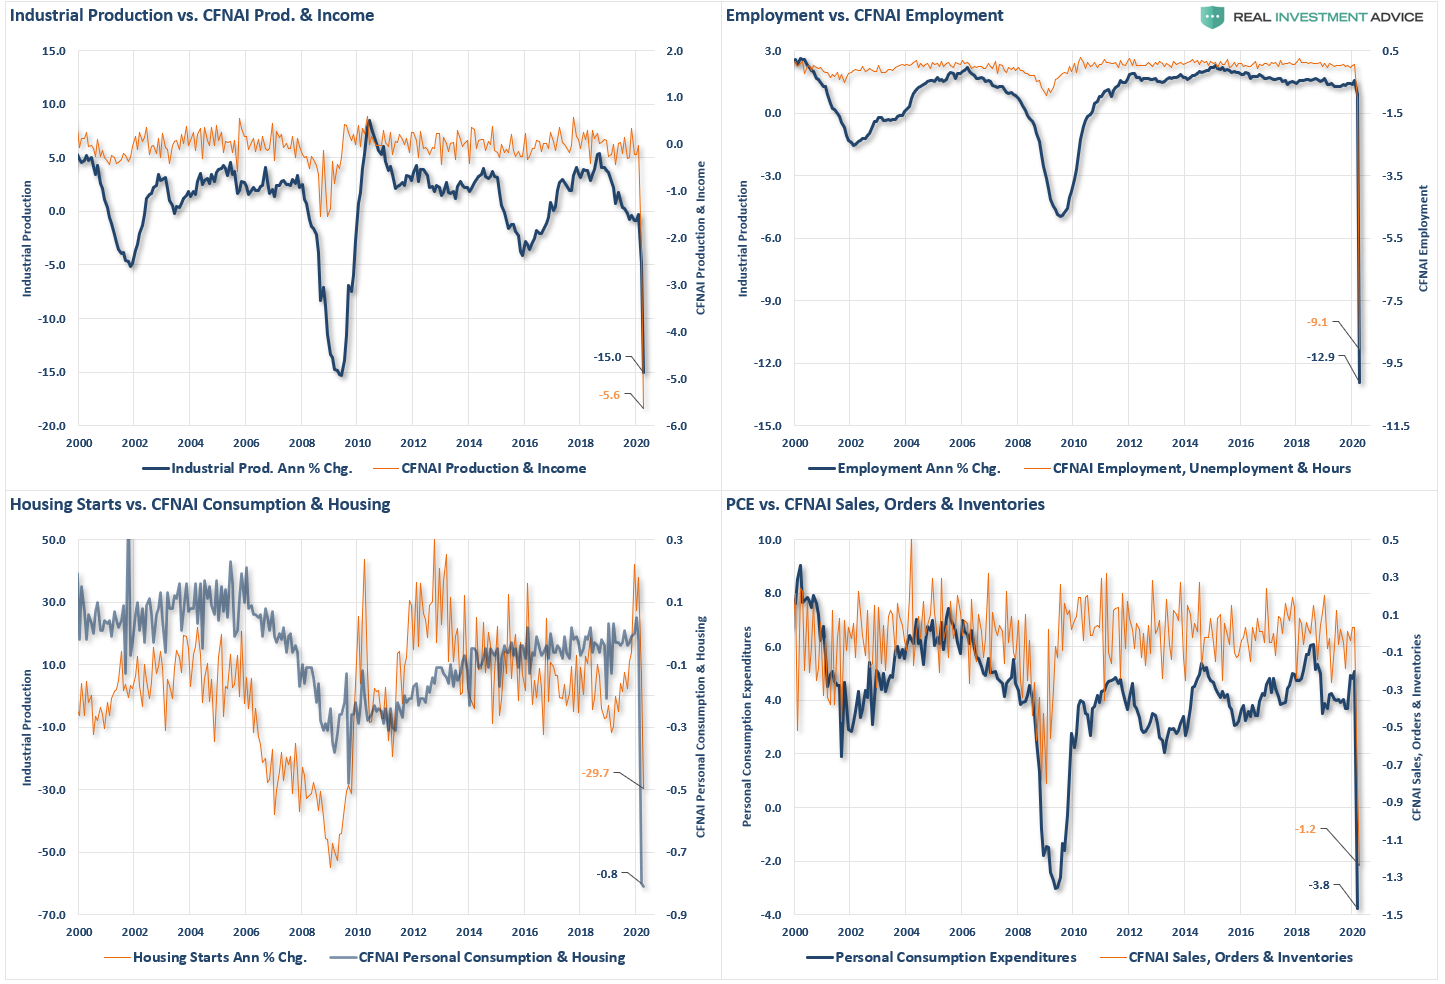
Analyzing the data in this manner provides a comparative base to the construction of the CFNAI.
The correlation between the CFNAI sub-components and the underlying major economic reports do show some very high correlations. Even though this indicator gets very little attention, it is very representative of the broader economy. Currently, the CFNAI is suggesting the mainstream view of a deep but short recession, is likely wrong.
A Composite Match
The CFNAI is also a component of our RIA Economic Output Composite Index (EOCI). The EOCI is a broader composition of data points, including Federal Reserve regional activity indices, the Chicago PMI, ISM, National Federation of Independent Business Surveys, PMI composites, and the Leading Economic Index. Currently, the EOCI further confirms that “hopes” of an immediate rebound in economic activity is unlikely. To wit:
“There is much hope that as soon as the ‘virus quarantine’ is lifted, everyone will return to work. The reality is that many businesses will cease to exist. Many more will be very slow to return to normal, and all businesses will be slow to rehire. Such will be the case until there is sufficient demand to support expanded payrolls.”

Currently, the EOCI index suggests there is more contraction to come in the coming months. Such will likely weigh on asset prices as earnings estimates and outlooks are ratcheted down heading further into 2020.”
The last sentence is the most important. Currently, the stock market is running at some of the highest valuations on record relative to both reported earnings and corporate profits. Given the economic debasement that is coming, the risk earnings estimates are still overly optimistic is a significant risk.
The correlation between the EOCI index and the market, as shown above, provides a clear warning. Currently, equity markets are priced as if the recession and economic compression have already passed. It hasn’t.
Forecasting The Market
The warning of lower asset prices from the EOCI is also confirmed by the CFNAI index.
The Chicago Fed also provides a breakdown of the change in the underlying 85-components in a “diffusion” index. As opposed to just the index itself, the “diffusion” of the components provide us a better understanding of the broader changes inside the index itself.
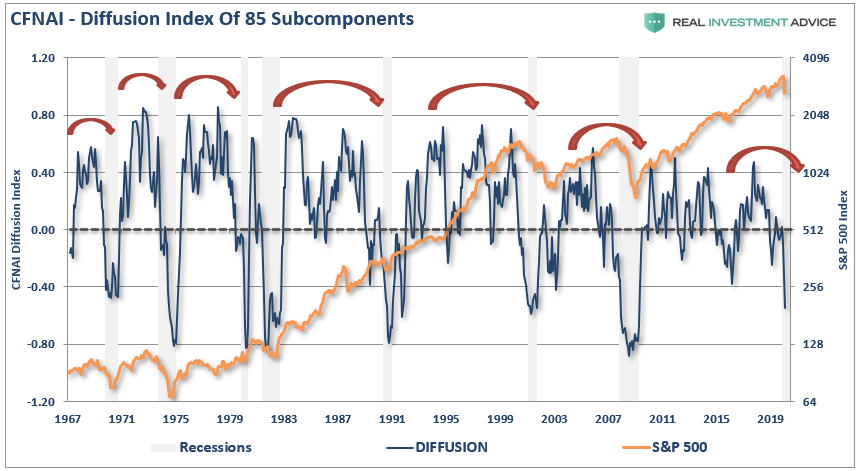
There two important points of consideration:
- When the diffusion index dips below zero, such has coincided with weak economic growth and outright recessions.
- The S&P 500 has a history of corrections, and outright bear markets, which correspond with negative reading in the diffusion index.
The second point should not be surprising as the stock market ultimately reflects economic growth. Both the EOCI index and the CFNAI maintain a correlation to the annual rate of change in the S&P 500. Again, the correlation should not be surprising. (The monthly CFNAI data is very volatile, so we use a 6-month average to smooth the data.)
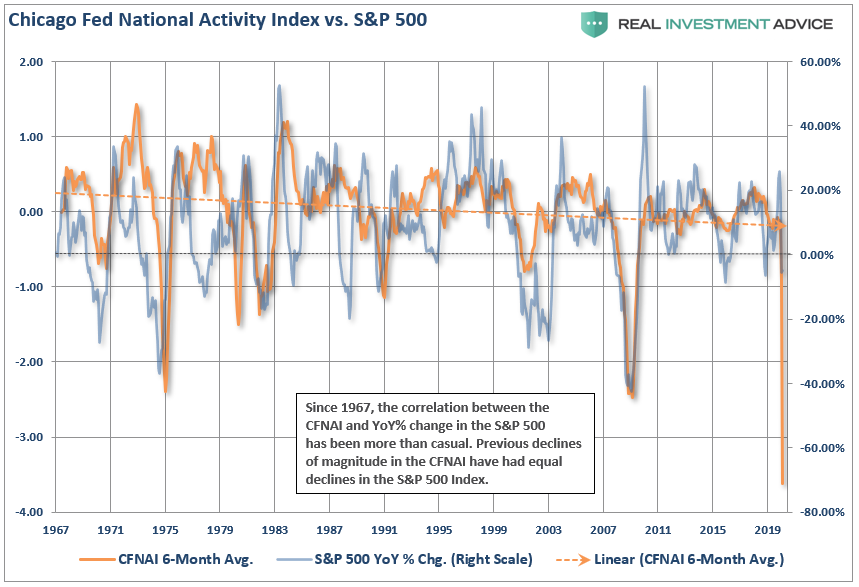
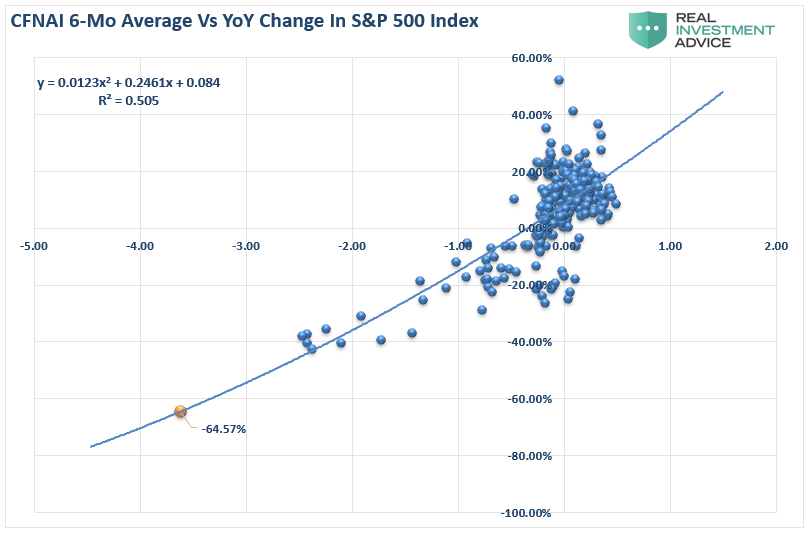
How good of a correlation is it? The r-squared is 50% between the annual rate of change for the S&P 500 and the 6-month average of the CFNAI index. More importantly, the CFNAI suggests the S&P 500 should be trading 64.7% lower to correspond with the economic damage. Throughout its history, the CFNAI tends to be right more often than market players.
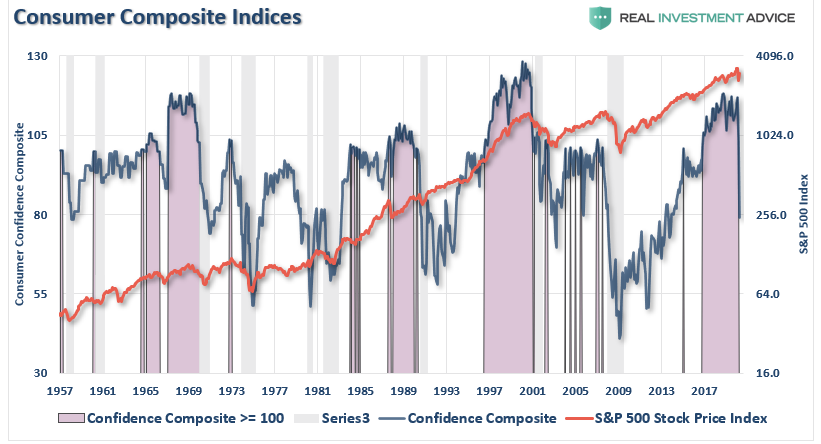
Investors should also be concerned about the high level of consumer confidence readings. While they have fallen from recent peaks, as we warned in 2019, they have yet to fall enough to correspond with the economic damage still forthcoming.
Overly Confident In Confidence
Here is a snippet from the article linked above:
“The RIA Composite Confidence Index, combines both the University of Michigan and Conference Board measures. The chart compares the composite index to the S&P 500 index. The shaded areas represent when the composite index was above a reading of 100.
On the surface, this is bullish for investors. High levels of consumer confidence (above 100) have correlated with positive returns from the S&P 500.”
The issue is the divergence between “consumer” confidence and that of “CEO’s.”
“Is it the consumer cranking out work hours, raising a family, and trying to make ends meet? Or the CEO of a company that has the best view of the economic landscape. Sales, prices, managing inventory, dealing with collections, paying bills, tells them what they need to know about the actual economy?”
Notice that CEO confidence leads consumer confidence by a wide margin. Such lures bullish investors, and the media, into believing that CEO’s don’t know what they are doing. Unfortunately, consumer confidence tends to crash as it catches up with what CEO’s were already telling them.
What were CEO’s telling consumers that crushed their confidence?
“I’m sorry, we think you are great, but I have to let you go.”
Despite hopes of a quick rebound in the economy and employment, the decline in CEO confidence suggests employment may be slow to return.
More Confirmation From CFNAI
The CFNAI also tells the same story as significant divergences in consumer confidence eventually “catch down” to the underlying index.
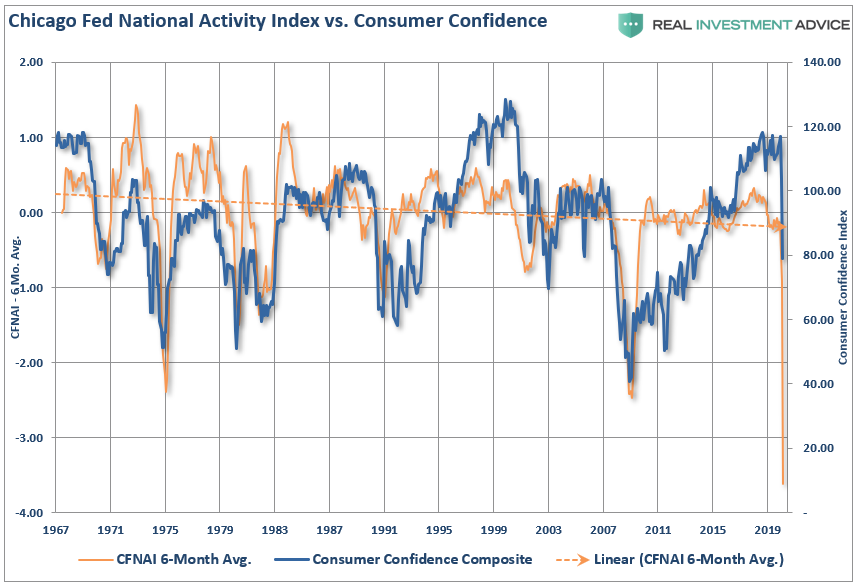
“This chart suggests that we will begin seeing weaker employment numbers and rising layoffs in the months ahead, if history is any guide to the future.”
While no one believe that statement then, the data was already telling us an important story.
CFNAI Includes The Fed
Importantly, the historical data of the CFNAI and its relationship to the stock market have included all Federal Reserve activity.
The CFNAI, and EOCI, incorporate the impact of monetary policy on the economy in both past and leading indicators. Such is why investors should hedge risk to some degree in portfolios as the data still suggests weaker than anticipated economic growth. The current trend of the various economic data points on a broad scale is not showing indications of a recovery, but of a longer than expected recession and recovery.
Economically speaking, such weak levels of economic growth do not support more robust employment, higher wages, or justify the markets rapidly rising valuations. Weaker economic growth will continue to weigh on corporate earnings and profits as troughs in the data have not yet been reached.
Portfolio Positioning
From a portfolio positioning perspective, if both the CFNAI and EOCI are correct in their outlooks, the rotation into cyclical, small-, and mid-capitalization stocks is likely wrong. As the economic impact weighs on earnings growth, defensive positioning will continue to pay dividends (literally.) At the same time, bonds will gain in price as yields fall towards zero.
The current rotation from the March lows was based on the premise of a sharp economic rebound. However, the data hasn’t confirmed it as of yet. Such also sets the market up for disappointment when the expected recovery in earnings growth fails to appear.
Reviewing the data from both the CFNAI and EOCI suggests the last point is most likely, as the driver for the former is lacking.
Maybe the real question is, why aren’t we paying closer attention to what these indicators are telling us?
Related: Technically Speaking: The One Thing Playing The “Bear Market” Rally