
Will it keep blowing off bad news, or keep tracking like the year-2000 bear market?
Some strange things are afoot in the stock market. The further we go into 2020, the more the market seems to think it’s 2000 all over again.
The one big exception, of course, is that 2000 did not include a pandemic. However, it did include a U.S. Presidential election. And, that election was expected to be a close contest. And, the winner was not determined for weeks after Election Day.
Hanging chads…again?
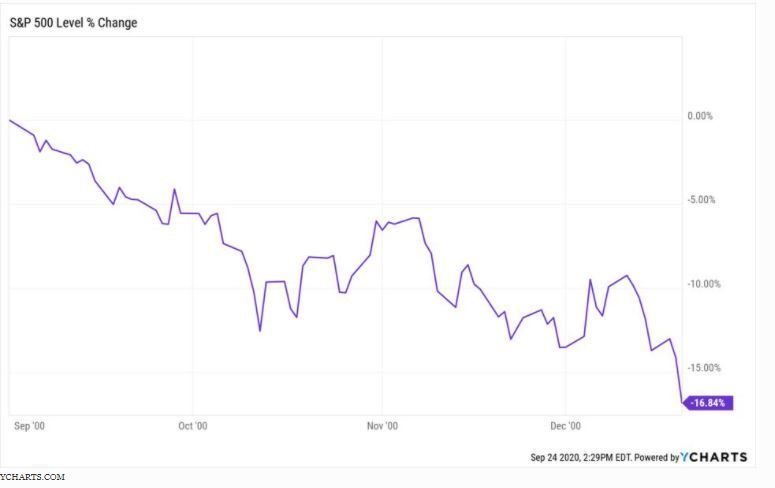
The other thing that occurred in the weeks leading up to the Bush/Gore contest? The stock market fell nearly 17% in under 4 months. Here’s the chart from September 1 through December 22 that year.
The S&P 500 has had a roller coaster year, but it has only been on a true “loop” on that coaster. It drifted higher to start the year, fell 33% in 5 weeks, then rallied all the way back. At its 2020 peak on September 2 (essentially the same time the 2000 market topped), it was up over 10% for the year.
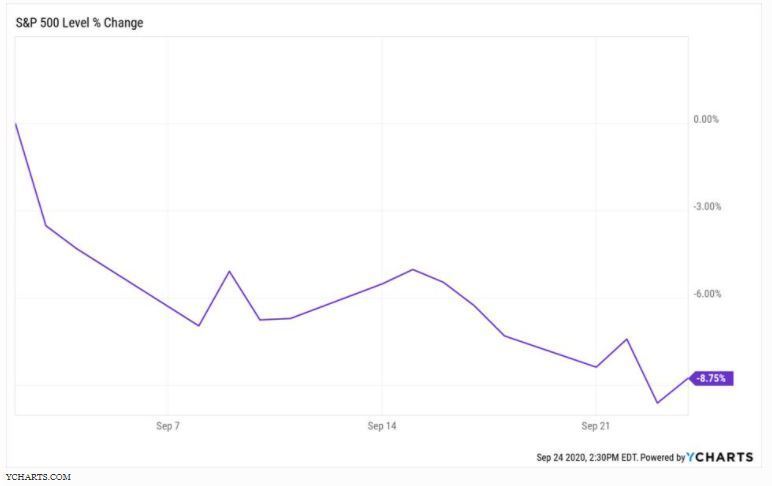
Selloff in progress
Here’s what has happened since. A 3-week decline, approaching the classic definition of a “correction.” This may just be an historical anomaly. But I don’t think so.
While a strong up market can happen at any time, my chart work indicates that the risk is heavily to the downside. The correlation to year-2000 is at the very least interesting, at best a way to track the market going forward.
After all, back in 2000, the market seemingly topped in March, bobbed up and down for 5 months, then peaked for good in September. So far, but for a few weeks here and there, the calendar is lining up similarly in 2020.
Is 2020 another 2000?
To summarize, the current S&P 500 pattern seems to be mapping out similarly to 20 years ago, except that the Covid-19 crash and rally accentuated what might eventually be considered the calm before the storm. Why do I say storm? Because the market decline of 2000 was the first of 3 straight down years for the major stock averages.
In both cases, the Nasdaq NDAQ +2.3% was the upside hero and the downside victim, though nearly all stocks and sectors tend to fall together. As they say, the only thing that goes up in down markets is the correlation between securities.
This is naturally a moving target. But as always, the time to figure out if bear market history might repeat itself is when the first signs occur, not after the fact.
Related: How The S&P 500 Overnight Guessing Game Impacts Your Wealth