
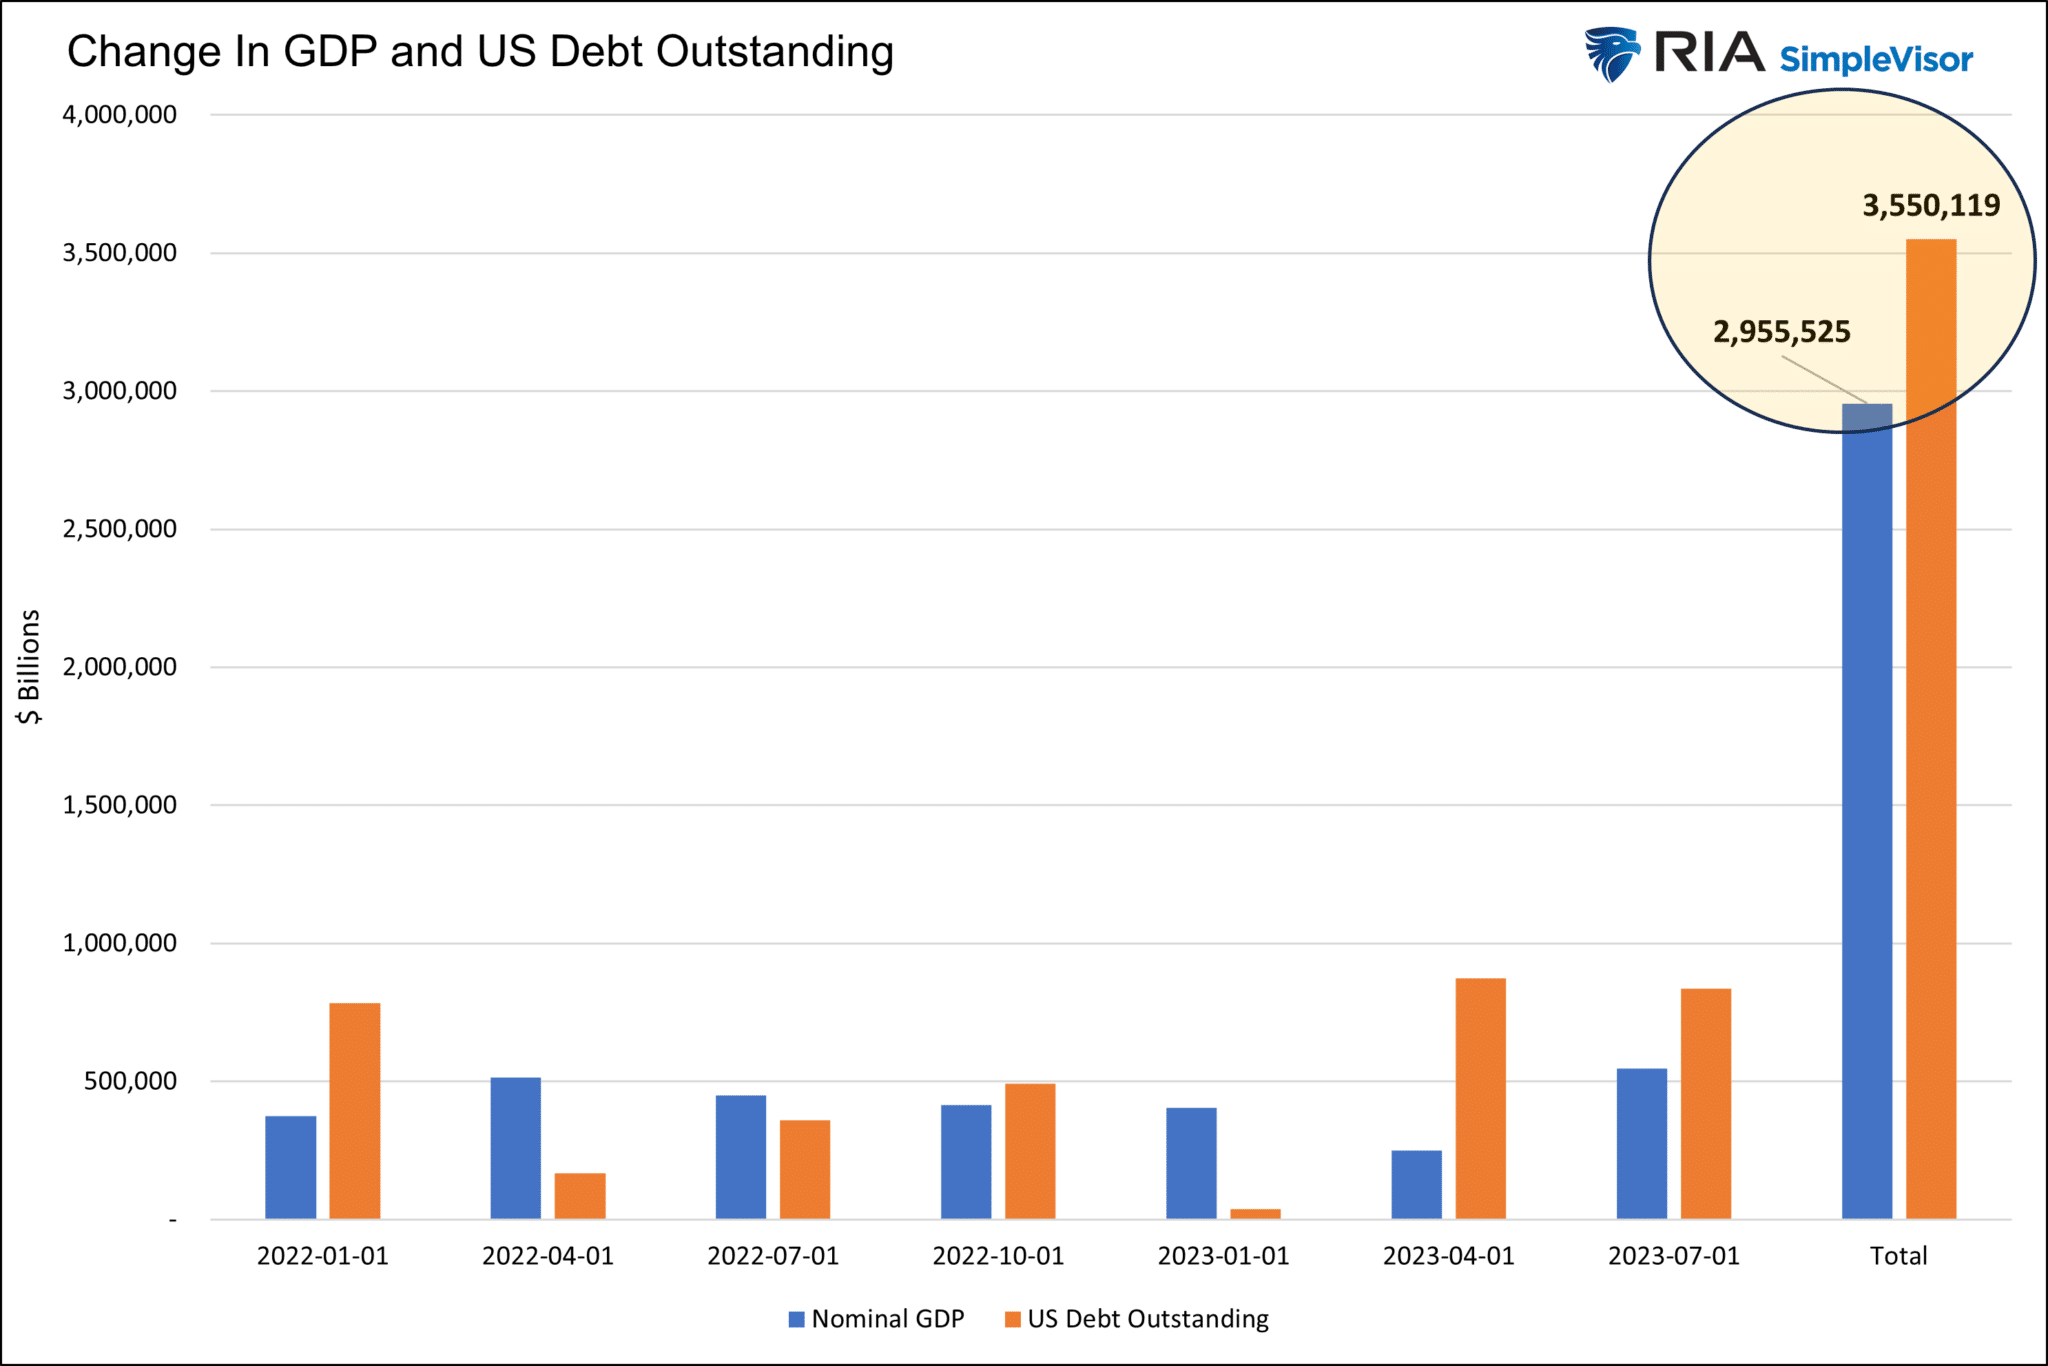
Since January 2022, nominal GDP has grown by $2.5 trillion or 5.77% annually. Such a growth rate is much better than the 4.30% annualized growth rate in the three years leading up to the pandemic. In fact, the last time the three-year annualized growth rate for the economy was better than that was after the first quarter of 2006. Considering the economic growth rate has been gradually declining for the last thirty years, the recent uptick in the growth rate is even more remarkable. Could the long-term downward trend in economic growth be changing? While such a reversal would be welcome news, the answer is not likely. Government spending, not productivity growth, demographics, or other fundamental economic factors, are almost solely responsible.
The graph below shows that in the seven quarters since 2022, government spending, as quantified by the change in Treasury debt outstanding, has increased by $570 billion more than GDP. While not all debt immediately feeds the economy, using the government’s deficit to track spending versus debt also shows similar results. The bottom line is that the economy has largely been stagnant without government spending and deficits over the previous two years. Of longer-term concern, government spending adds to economic growth when the money is spent. However, it weighs on economic growth once the benefits elapse. Recent government debt issuance and spending will become headwinds to growth in the years ahead.
What To Watch Today
Earnings

Economy
Investing Summit: Early Bird Registration Available Now
January 27th, we are hosting a live event featuring Greg Valliere to discuss investing in the 2024 presidential election. What will a new president mean for the markets, the risks, and where to invest through it all? Greg will be joined by Lance Roberts, Michael Lebowitz, and Adam Taggart for morning presentations covering everything you need to know for the New Year.
Register now, as there are only 150 seats. The session is a LIVE EVENT, and no recordings will be provided.

Market Trading Update
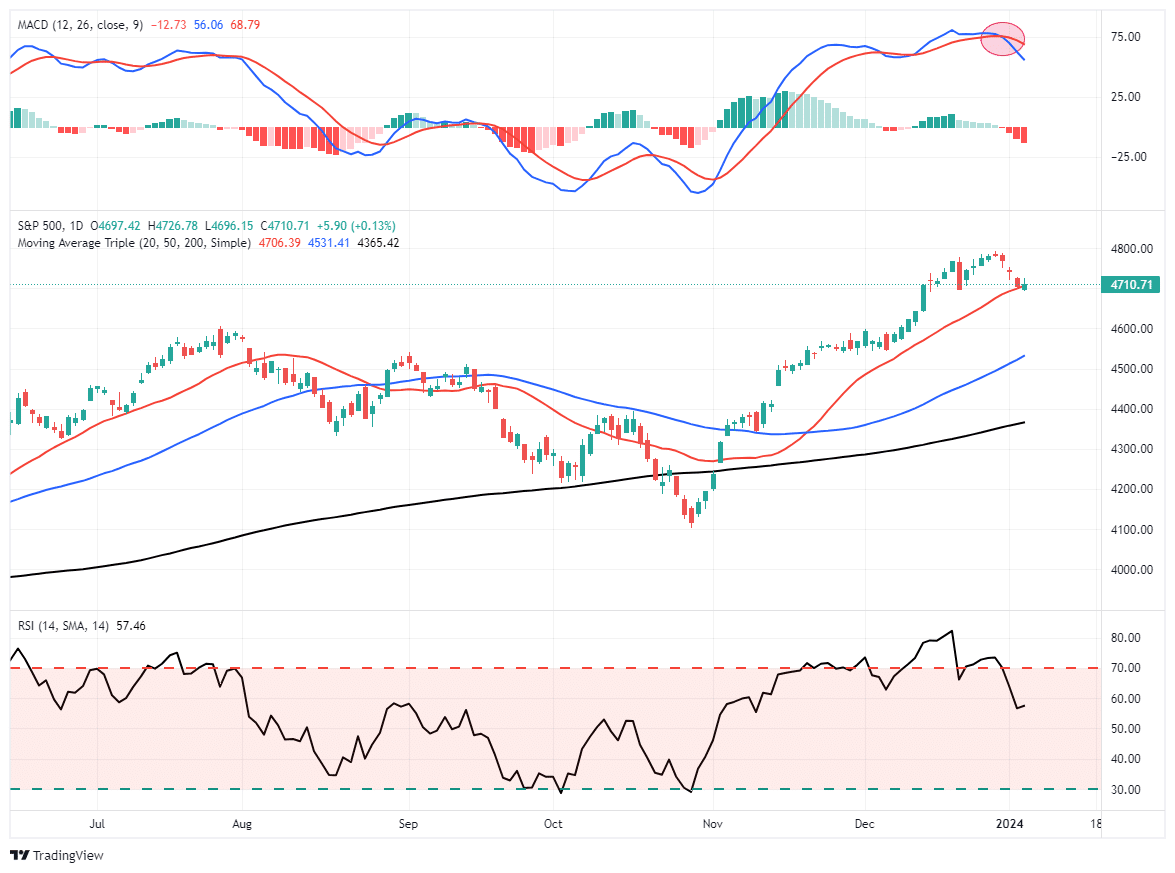
It has been a rough start to the year. As noted yesterday, much of the selling is due to tax gain selling. To wit:
“Quite often, year-end trading is not a function of recent economic trends, earnings projections, or other traditional economic/fundamental/geopolitical factors. Instead, window dressing, mutual fund rebalancing, tax loss selling, and other seasonal factors often take charge as December marches on. Accordingly, trading at the start of a new year is also heavily affected by the hangover or the reversal of year-end trades and tax gain selling. To help you appreciate why the new year makes a difference, consider the following question: If you can defer your capital gains liabilities (taxes) by a year just by waiting one trading day, why wouldn’t you?”
The recent decline has started to work off some of the more overbought market conditions, but with a MACD sell signal intact, the risk to prices in the near term is likely lower to reset the recent outsized gains from November. Furthermore, with a high percentage of stocks above their respective 50-DMA, the risk of a further correction is likely.
Continue to maintain equity exposure currently but look for a reversal of the MACD signal for the next entry point to increase portfolio exposure to target weights for the year.
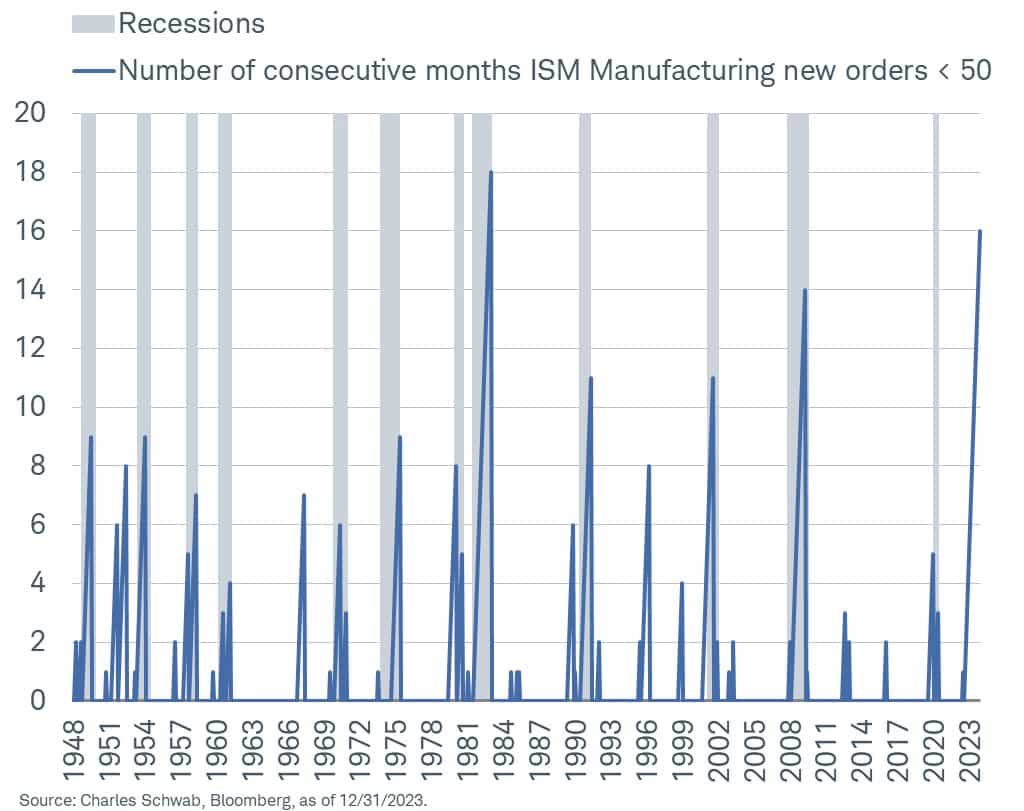
ISM Continues to Warn of a Recession
Despite robust economic growth, the manufacturing sector has been in a recession for the better part of the last two years. Within the ISM manufacturing survey, new orders tend to be an excellent leading indicator of recessions. Since 1948, there have been 15 instances where ISM new orders were below 50 for four months or longer. Twelve of those were followed by a recession. Of the 15, one is the current instance, and the other two occurred in 1996 and 1966.
At 16 consecutive weeks of sub-50 readings, recession warnings are ringing, but the economy seems to be powering ahead thanks to the service sector and, as we noted above, government spending.
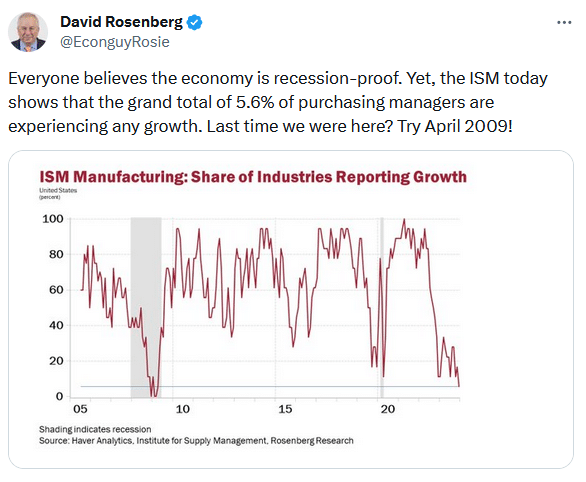
Also, Dave Rosenberg picked up an interesting fact in the ISM survey. Per his Tweet below, how can 95% of the manufacturing companies surveyed be experiencing zero or negative growth without a recession?
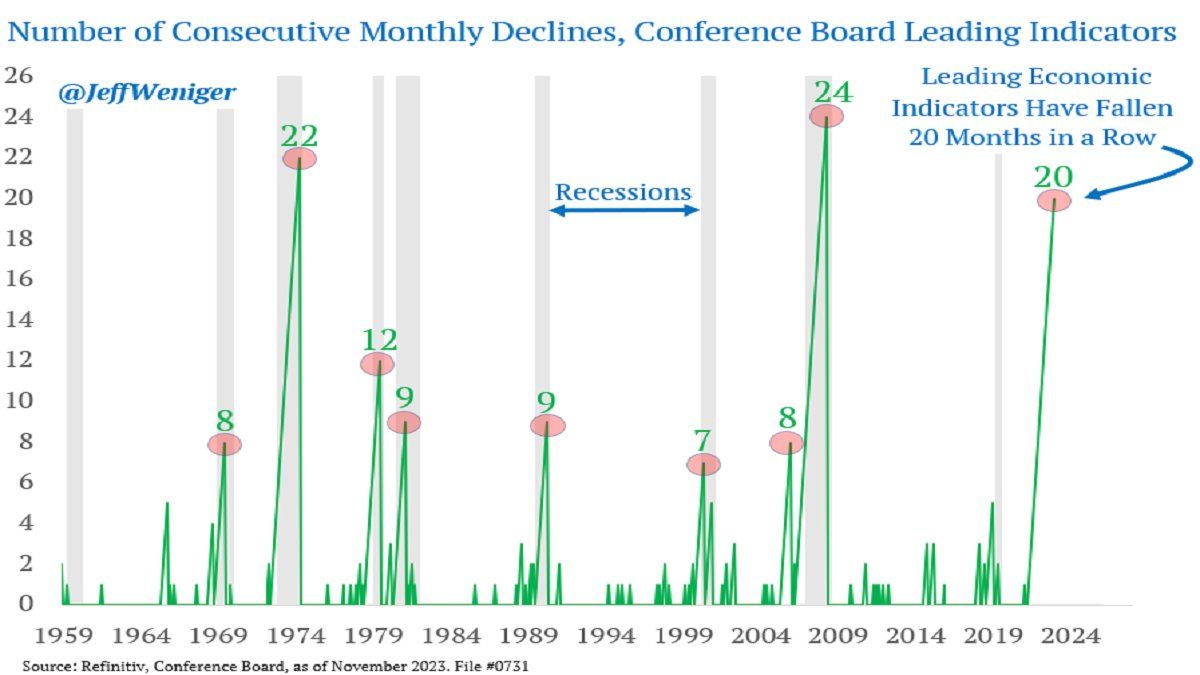
More Recession Warnings
As we discussed in the prior paragraph, some economic data definitively points to an imminent recession. For example, the following graph courtesy of Jeff Weniger. He shows that leading economic indicators have fallen for 20 months in a row. Such a streak without a recession is unprecedented. So the question we are left to ponder is, why, with many solid recession indicators flashing red, is the economy running on all cylinders? For starters, there is still stimulus in the system from the Inflation Act and leftover from the pandemic that propels growth. Government spending is a powerful economic tool. With balanced budgets, we would have likely been in a recession for the better part of the last two years.
As we head toward the elections, we should expect Biden to continue spending. This is the oldest trick in the book for trying to win a second term. It is also why markets in the fourth year of a presidential term often perform better than average. For more on this, see our Commentary from Wednesday.
Tweet of the Day
“Want to have better long-term success in managing your portfolio? Here are our 15-trading rules for managing market risks.”
Related: The Presidential Election Provides Stocks a Tailwind for 2024