
Charts help, but sentiment is the deciding vote
Well, you can’t say this was overdue. The stock market has been on borrowed time for a while. In particular, the S&P 500 Index has defied gravity for over 2 years. While cracks appeared in many market areas, the “headline indexes like the S&P 500 and the Dow stayed at levels which convinced the investing public that all was well.
Now, we are presented with a historically-vicious selloff. Do you “buy the dip,” as the expression goes? Or, do you act as if we have seen the top of the long bull market, and use fierce rallies like Tuesday’s to shift toward bear market mode?
As usual, history offers clues. But as I will show you below, the ultimate answer is that and more.
History says bear markets start with a seemingly buy-able dip
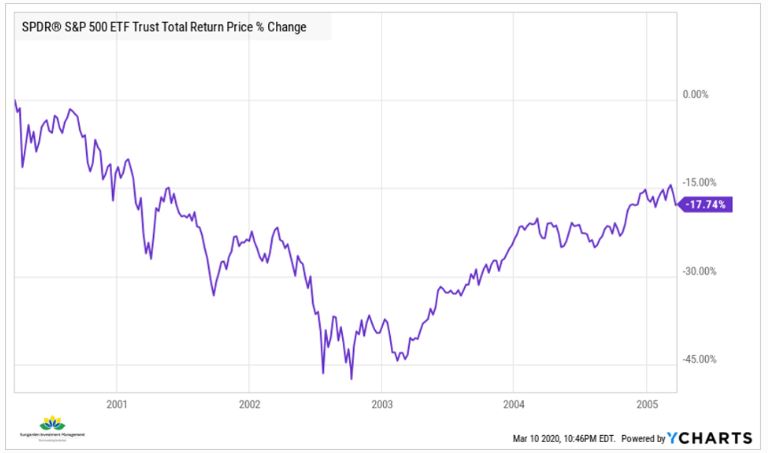
First, the history. This is how the Dot-Com Bubble ended. The S&P dipped in March of 2000, rallied back to nearly its previous high, and then moved lower and lower, with each dip disappointing more eager buyers than the one before it. When it was over, 3 years later, the S&P 500 had cratered by nearly 50%. What’s more, 5 years after the top, it was still essentially in bear market mode, nearly 18% below that early-2000 high.
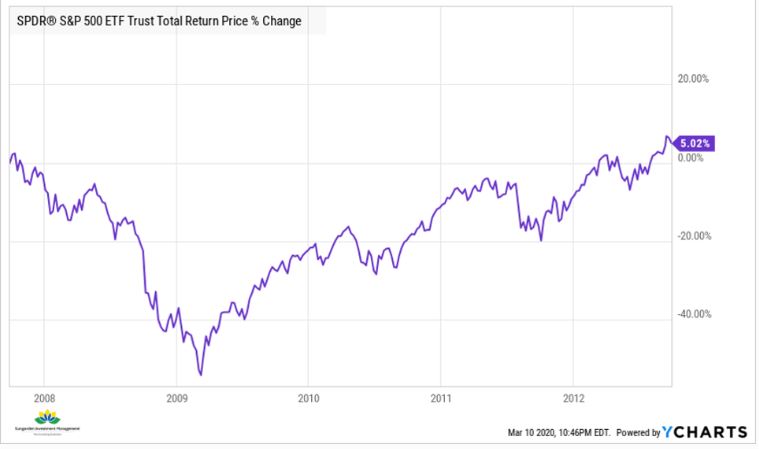
Later that decade, the Financial Crisis evolved similarly. A dip in late 2007, when Bear Stearns’ collapse made it obvious that the environment was changing quickly. Then, 2008 happened. And so did early 2009. Bottom line: a market crash of about 50%, which took about half the time (18 months) of the previous bear market, the one I showed you above. Again, it took a while to recover. By late 2012, the S&P 500 was still only 5% above where it peaked in 2007.
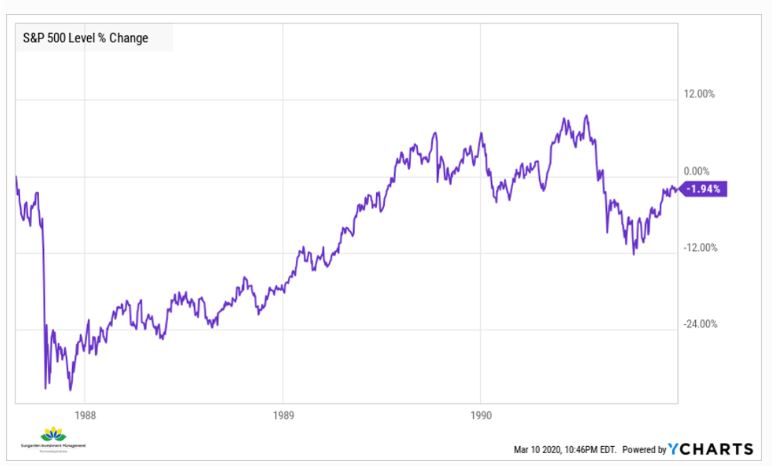
No survey of market tops would be complete without a look at the Crash of 1987. While this did not prompt a recession like the other 2 did, the result for investors was similar. By late 1990, 3 years after the infamous 22% plunge in the index on October 19, 1987, the S&P 500 was just about where it had been before the 1987 one-day debacle.
The current predicament
Every one of these severe market downturns started with what some considered to be a harmless, buy-able dip. And, that brings us to today’s market, shown below.
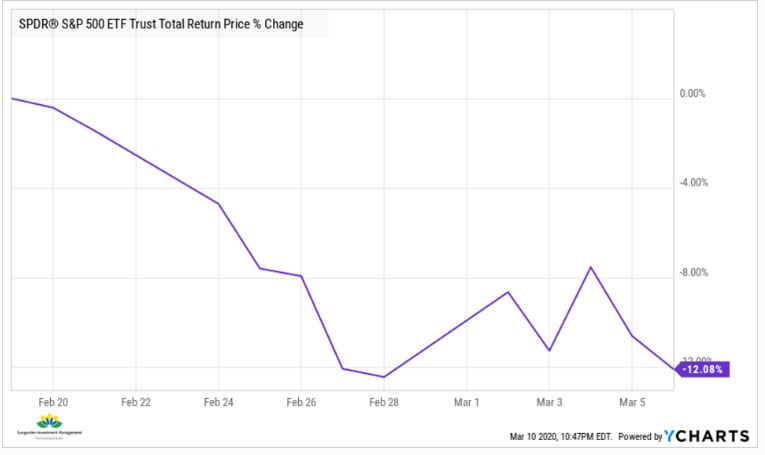
Dip or top?
We may not know for a little while. However, I think the tell-tale sign is something that is, if you will, a by-product of the type of price movements I showed you above. I am talking about “sentiment.”
That is, the emotions investors feel toward the stock market and investing. True bear markets change that feeling. It goes from euphoria, overconfidence and, dare I say, hubris, to shock, denial and frustration.
We don’t know the ultimate outcome of this recent market dive. However, using history as a guide, I would not bet on this being simply a dip. That means investors must prioritize aggressive capital preservation. It also means they need to think VERY differently about how to grow their capital in the months, and maybe years ahead. More on that in my next article.
Related: Time To Check The 1987 Crash Playbook. Here’s What To Know