
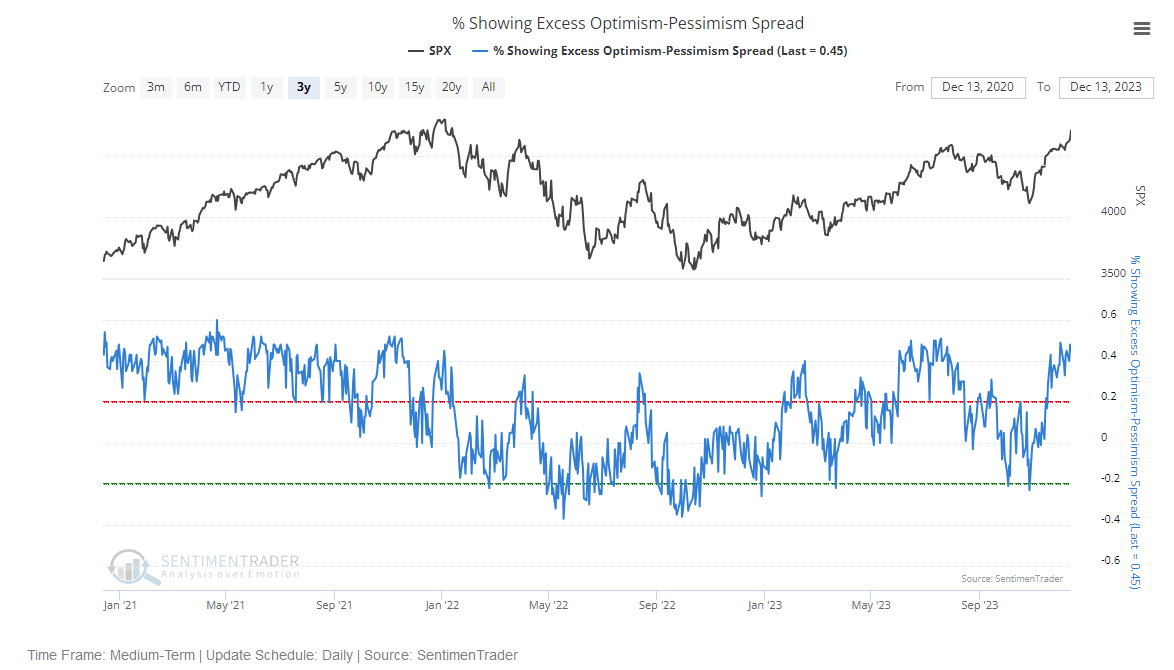
In Tuesday’s Commentary, we shared four indicators of market breadth. While they all show robust breadth was driving markets higher, they also point to high levels of overboughtness. We stumbled across the following analysis from Sentimentrader, which further confirms the market is temporarily overly optimistic, overbought, and due for a correction. The graph below shows the spread between their proprietary indicators, showing excessive optimism and pessimism. Per Sentimentrader, 28 of the sentiment indicators they track show optimism, while only four show pessimism. Further, “More than half of our core indicators recently showed excessive optimism, while few showed pessimism. The spread between those indicators recently reached the 2nd most extreme level in two years.”
The graph below charts their % Excess Optimism-Pessimism Spread (blue). Sentimentrader deems a reading above +0.2 as extreme optimism. Per Sentimentrader: “The higher the spread, the more likely stocks are seeing too much optimism and will struggle going forward.” Based on the analysis, we should expect a -2% annualized return while the indicator remains above 0.2. Returns average +7.0% annualized when between the extremes and +43% when in extreme pessimism. The return data is only for the three years shown.
What To Watch Today
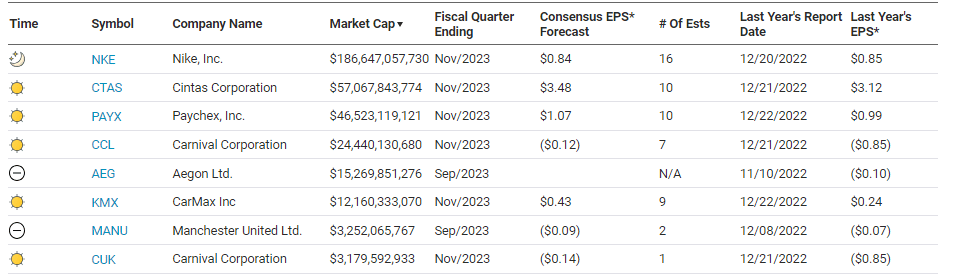
Earnings
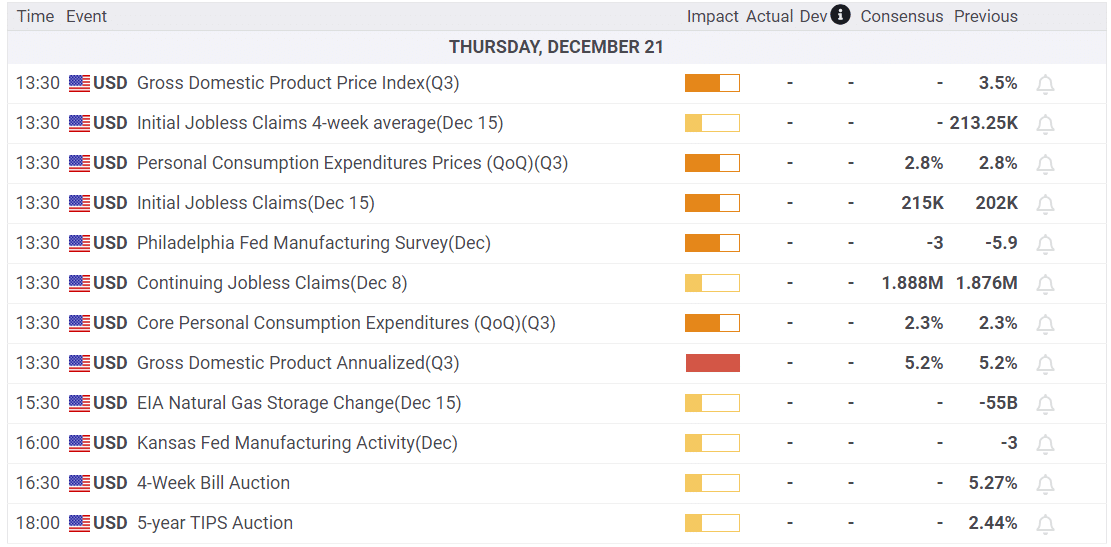
Economy
Market Trading Update
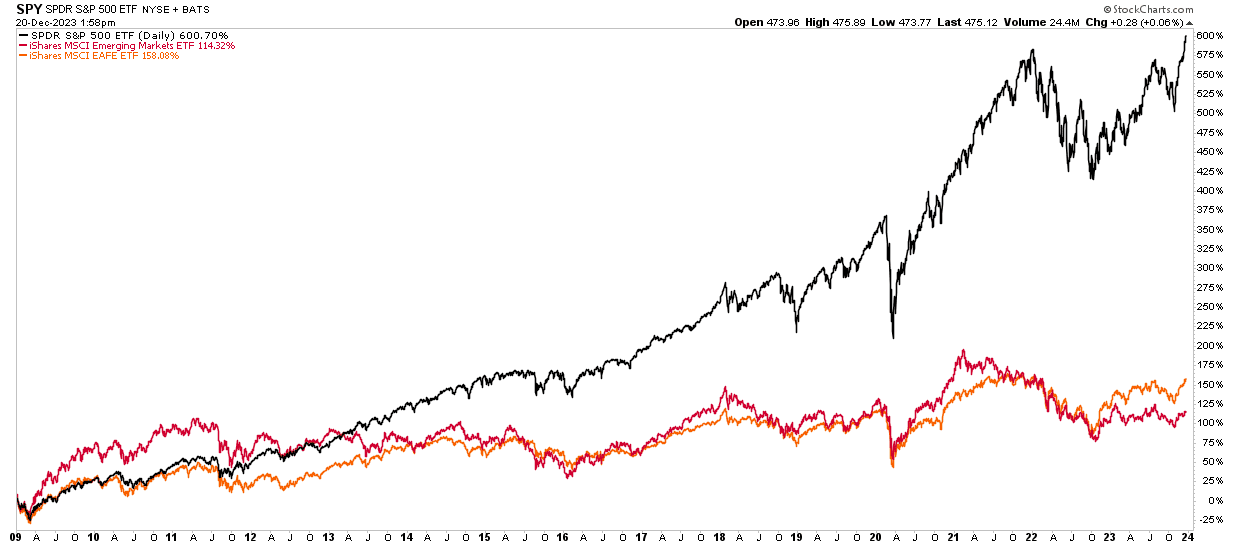
As we head into next year, we are once again hearing the familiar siren song that 2024 will be the year of the international markets. This has been a perennial favorite of those bearish on the U.S., the dollar, and bonds, suggesting that those countries will perform better due to valuations. However, the key to their argument is always “valuations RELATIVE to the U.S.”
Yes, on a relative basis, valuations of emerging market countries are cheaper than the U.S. However, they are not the U.S., they are primarily export dependent on the U.S., and they are not a safe haven for reserve currencies. As such they should be cheaper than the U.S. The question that should be asked is whether those markets are cheap relative to themselves. In that case, they are not.
But more importantly, an investment in both International and Emerging Market indices has yielded a far lower return than being solely domestically allocated. Given the global debt, geopolitical risks, and exceedingly poor economic management of those countries, it is likely that 2024 will be another year where allocations to these economies are likely to underperform.
FedEx Flops
FedEx (FDX) opened 10% lower as its U.S. package volume declined by 3.5% versus the previous quarter and 15.1% compared to last year. The company’s earnings and revenues were below Wall Street estimates. FedEx claims that market conditions remained soft, with lower demand than anticipated.
While it’s tempting to think the disappointing data from FedEx points to a weakening economy, keep in mind that Amazon is rapidly stealing market share from the company. In late November, we wrote the following in our Daily Commentary:
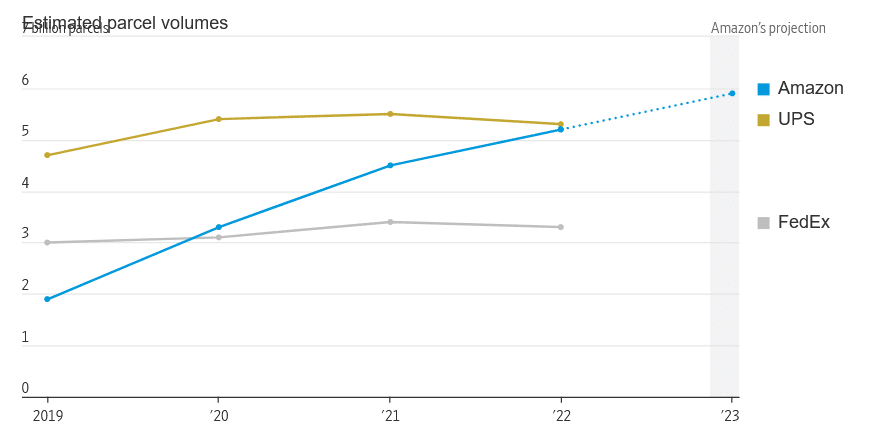
The graph below from the WSJ shows that parcel delivery growth has flatlined at UPS and FedEx while it has grown rapidly at Amazon. Amazon uses a creative strategy to expand its services. For about five years, they have been employing contractors to help meet their customers’ needs. They now elicit the help of over 200,000 contractor drivers. The strategy allows them to expand their network, reach more customers, and keep revenue in-house. Revenue at UPS and FedEx has grown 5x and 9x, respectively, since 1993. However, both companies are witnessing declining revenue over the last year. In the past 30 years, they only experienced falling revenue during the recession of 2008/09. Amazon is a problem for UPS and FedEx.
Bond Optimism Is Also Getting Extreme
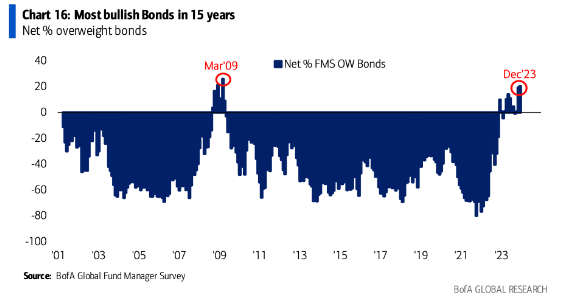
Bond fund managers worldwide are more bullish on bonds than at any point since the financial crisis fifteen years ago. As the chart below shows, bond fund managers tend most often to be underweight bonds. In fact, in late 2022, the percentage of fund managers underweight bonds was the greatest since at least 2000.
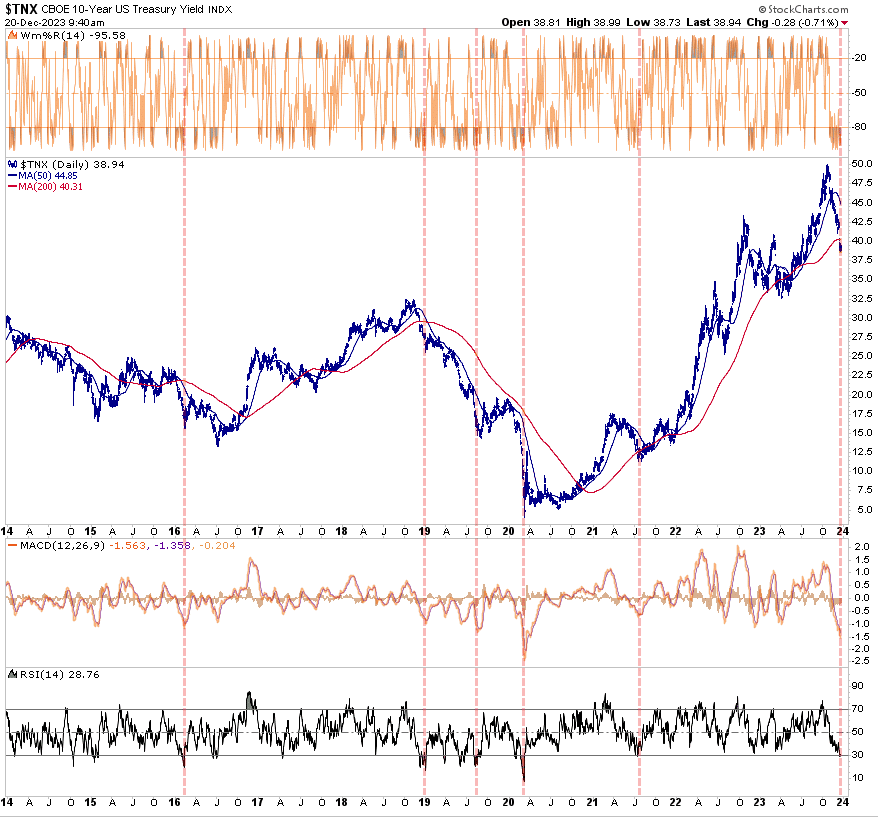
The second graph shows that the recent bond rally is getting extreme, and a short-term pullback is likely. The dotted vertical lines show similar periods when the RSI was at or below 30, and the MACD was at very low levels. In the 2014-2016 and 2019 bull markets, those instances produced a short period of higher yields before resuming lower. Conversely, low RSIs and MACDs were good selling points in the recent bear market. If we are back in a bull market, any increase in yields will likely be short-lived.
If you think inflation continues to head lower, such a pullback would provide a good entry point or the chance to add further to existing bonds. We caution that with many investors short bonds or holding fewer bonds than they typically prefer, year-end buying can continue through next week. Such does not negate the likelihood of a temporary increase in yields thereafter.
Tweet of the Day
“Want to have better long-term success in managing your portfolio? Here are our 15-trading rules for managing market risks.”