
"There’s a lot to suggest that this is still a very fragile recovery despite the fact it continues to look resilient on the surface". -State Street CIO Lori Heinel
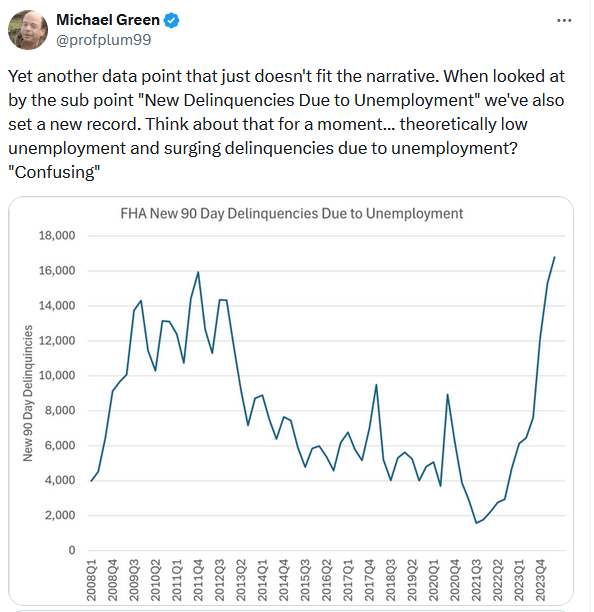
While most Wall Street economists have backed down their forecast for Fed Fund rate cuts from six to two, State Street remains very aggressive. They believe the Fed will cut rates by 50bps at the June meeting and cut another full percent before the end of the year. Per a Bloomberg article summarizing State Steet’s bold prediction, they have three reasons to buck the consensus. First, as Lori notes, economic data is strong but very inconsistent. For instance, today’s Tweet of the Day shows that FHA delinquencies due to unemployment are higher than 2008 levels, contradictory to robust jobs data from the BLS. But then again, so is the notion that part-time jobs are increasing rapidly while full-time employment declines.
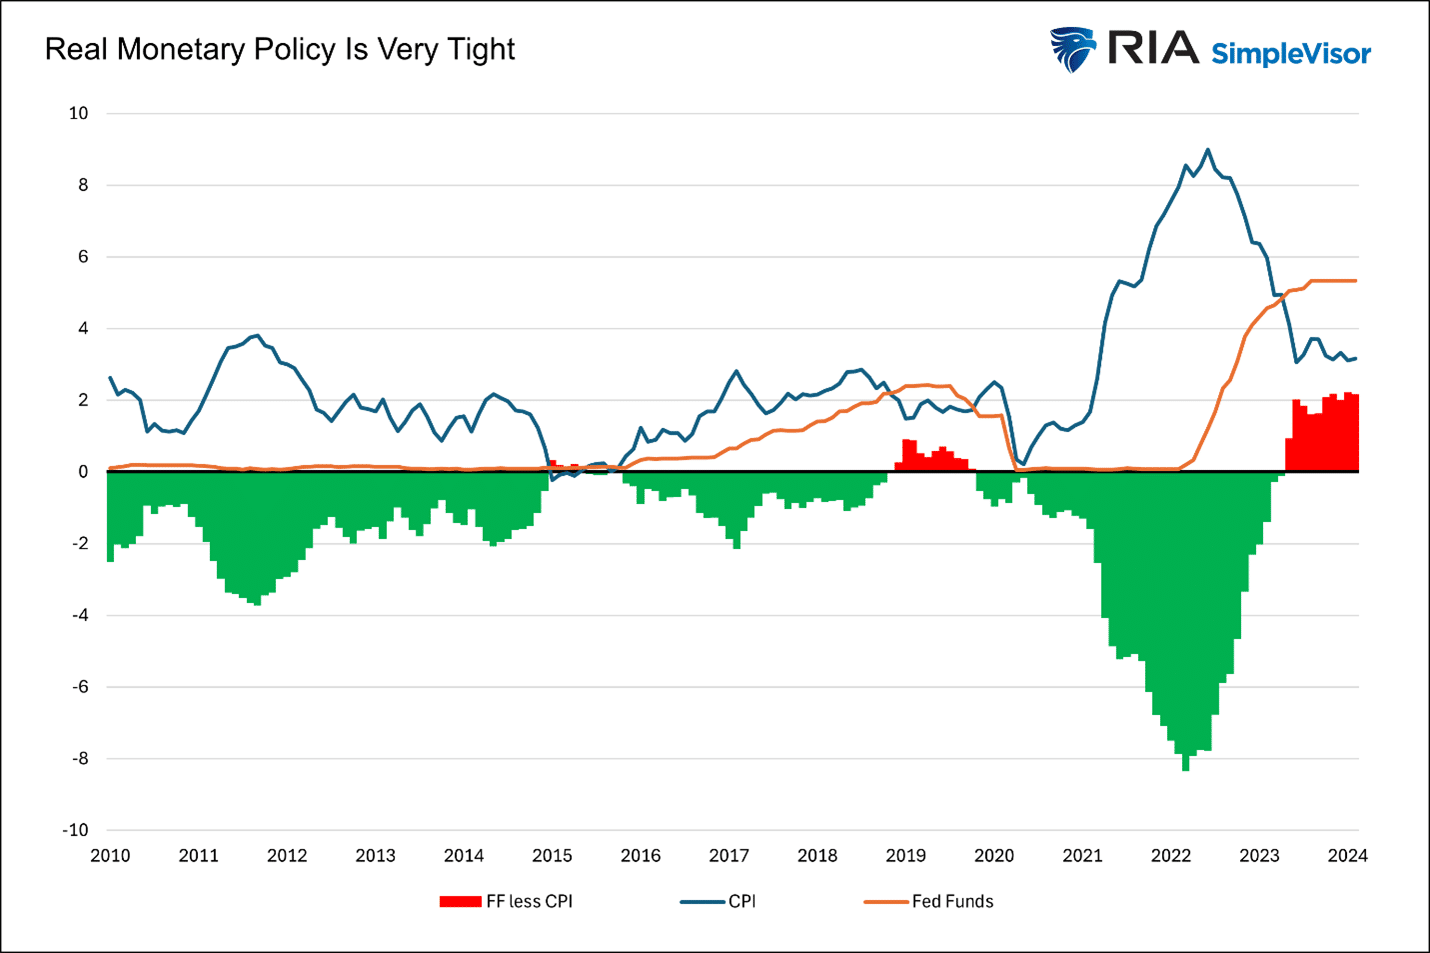
State Street also believes that even with inflation running higher than normal, the current level of Fed Funds is too restrictive. As we share below, real Fed Funds are 2% above inflation, which is by far the most restrictive policy we have seen in fifteen years. Lastly, State Street believes the Fed does not want its actions to be seen as politically motivated. Per the article: “Obviously, the Fed will say they are not political, but there will be a lot of scrutiny, and they won’t want to be active in that window right around the election.”
What To Watch
Earnings

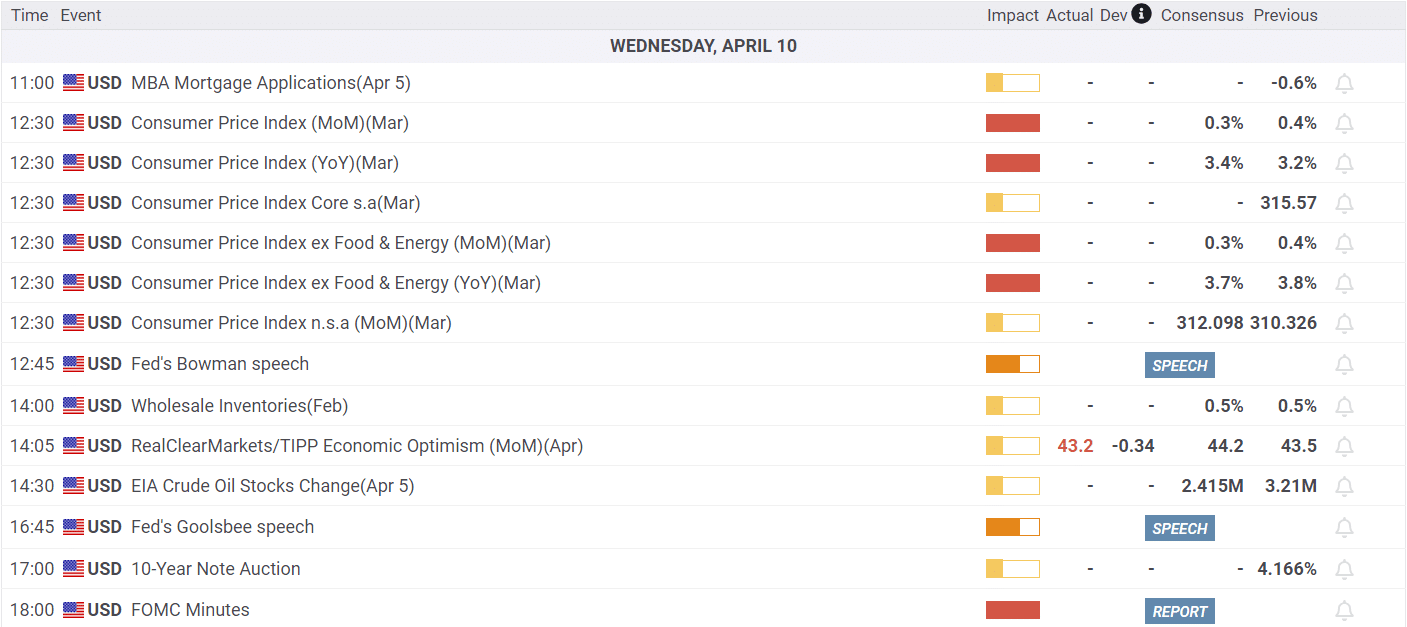
Economy
Market Trading Update
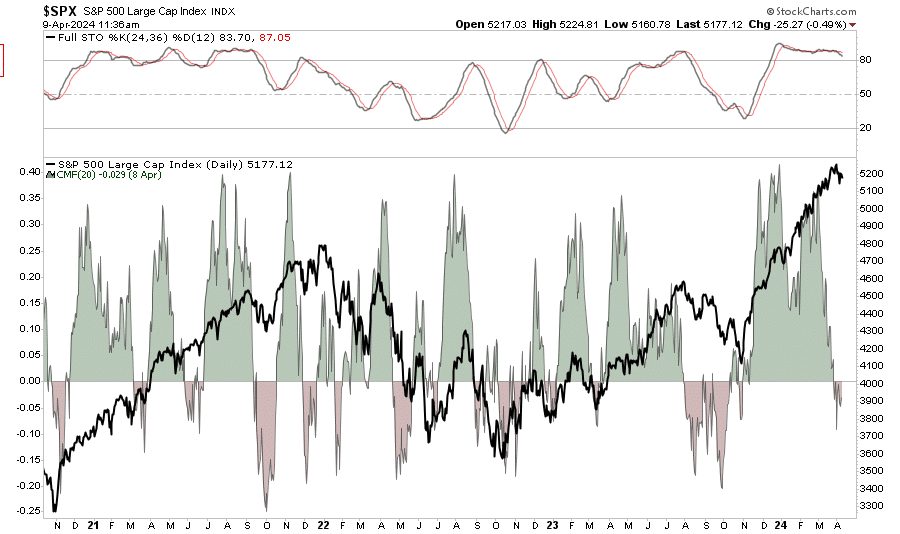
As discussed yesterday, the break of the 20-DMA from last week remains a significant crack in the market’s bullish armor. On Friday and Monday, the market regained that previous support level. However, as noted in Monday’s morning brief:
“We are specifically looking at where the market closes for the week. The break of support on Thursday is important, and regardless of what happens intra-week, if the market closes below Thursday’s close, the break of support will be confirmed. We give the market time to reduce the “whipsaw effect” of daily market moves. “
Yesterday, the market again broke below the 20-DMA, although it recovered by the end of the day. The loss of momentum is notable and suggests that weakness is spreading. But, as we discussed, we are waiting to see where we close trading for this week before making any specific strategy changes.
It is worth noting that the Chaikin Money Flow index has turned negative, which is consistent with weaker market performance. Notably, the bullish trend remains intact, and bullish sentiment remains elevated. However, as noted, there are visible cracks in performance that are worth noting. We have previously recommended hedging risk accordingly, and that mandate is becoming more pressing. Today’s “inflation report” could add another layer of risk to market dynamics.
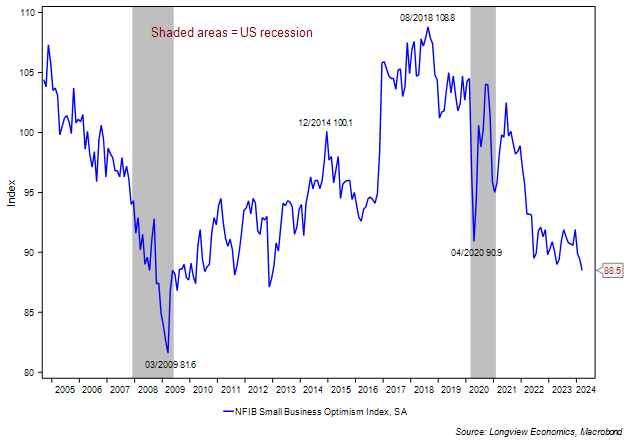
NFIB Declines And Is At Odds With GDP And Employment Data
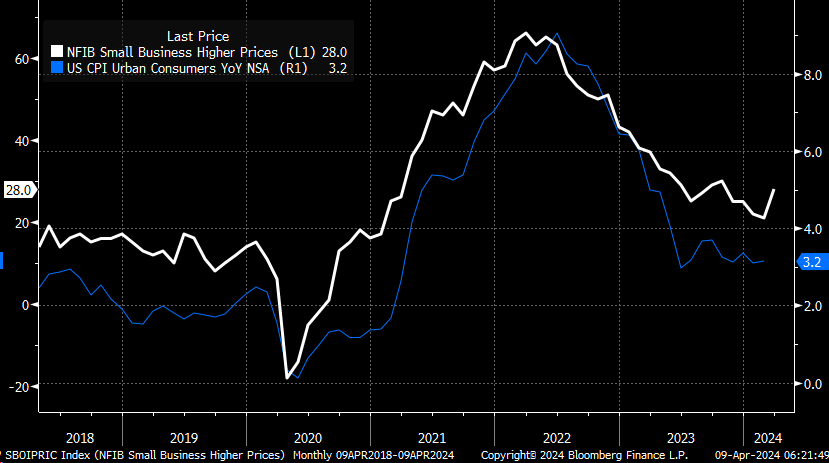
For the seventh time in the last eight months, the NFIB small business survey has declined. The survey index now sits at 12-year lows. Further, it is now lower than at the trough of the Pandemic economic shutdown. There are a few areas of particular concern within the report. First, those businesses reporting higher selling prices rose moderately back to levels last seen in October. The second graph shows a robust correlation between the NFIB selling prices gauge and CPI. The second is that those expecting higher sales declined to new lows. We find it odd that small business firms plan on raising prices as expected sales are falling.
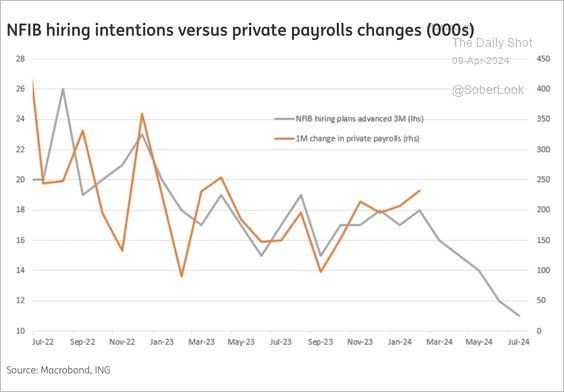
The third graph shows that hiring intentions continue to fall. This index has a solid three-month leading correlation with payrolls. Small businesses account for nearly 50% of private sector workers and about 45% of GDP. Accordingly, this latest round of small business data does not jibe with the strong employment and GDP trends but does give credence to State Street’s concern about weak data lurking underneath the surface.
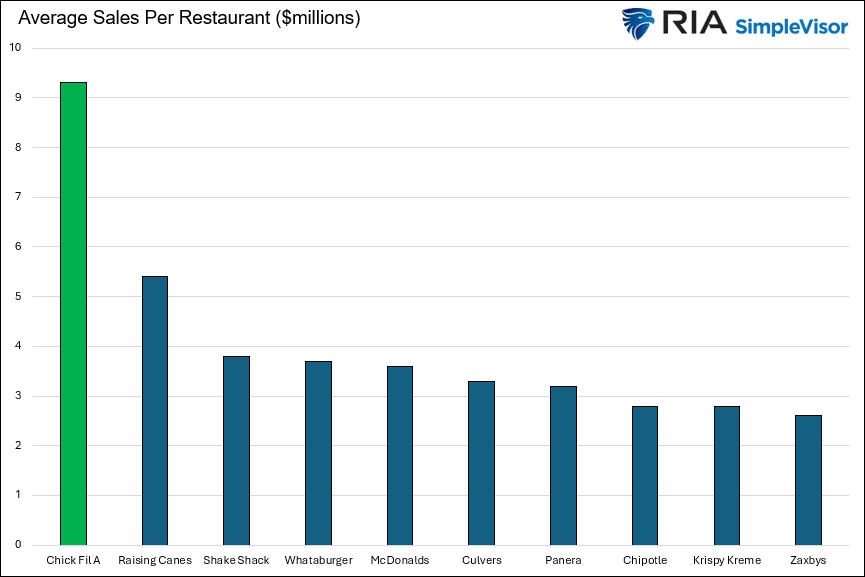
Chick-fil-A Takes The Crown
Chick-fil-A just announced that its average sales per restaurant for 2023 was $9.3M. That number is exceptionally high compared to its competition. The graph below shows that Chick-fil-A’s revenue per store is more than double that of all its competitors except Raising Canes. Unfortunately, Chick-fil-A is a private company, so investors can not take advantage of its significant productivity advantage.
Tweet of the Day
“Want to have better long-term success in managing your portfolio? Here are our 15-trading rules for managing market risks.”