
Written by: Jacob Wolkowitz, CFA
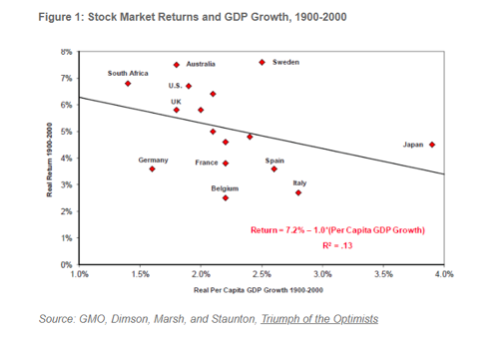
Over the past few weeks, we have had many conversations with clients that touch on the fact that the economy is in free fall while the stock market has been recovering briskly since March 23rd. Although the recent divergence has been stark, this follows a historical pattern. The connection between stock markets and the economy is very weak if there is one at all. Although the importance of Belgium may be overstated in this chart, the relationship between economic and market growth may actually be negative:
More recent history confirms this. If we think of best performing economies over the last ten years, we think of countries such as China and India, but until recently both have had poor stock market returns. Prior to COVID, US GDP growth rarely exceeded 2% a year, but equity markets returned better than 14% a year from 2009 to 2019. Once again, the relationship appears to be upside down.
As we recently noted, the US equity markets are more concentrated than is typical, and those companies are relatively small employers. As a recent NY Times article stated, "the two most highly valued companies in the country in 1962 - AT&T and General Motors - employed nearly 1.2 million people combined. Last year, the two largest companies in the S&P 500 - Microsoft and Apple - employed 280,000." Microsoft enjoys a 30% margin while Apple makes do with only a 22% margin. Comparatively, the average profit margin for S&P 500 members is just 10%, which is historically high. Of course, this is not just a US phenomenon, and globalization has further blurred the lines between the nationality of a company and its actual business operations. Currently, S&P 500 constituents generate 40% of revenue from outside the US, while exports only represents 12% of GDP.
Driving a final wedge between the real economy and the stock market is the Federal Reserve. In thinking back on the conversations we've had in the past month, there is a lot of discussion on elections and Trump and Pelosi, but rarely do we discuss Powell or Lagarde. The Fed's actions are often cloaked in acronyms and abstractions, but the effects are tremendously powerful. As we can see in the chart below, the Federal Reserve has increased their balance sheet by about $3 trillion over sixty days, which nearly equals their total effects for the entire duration of the global financial crises:
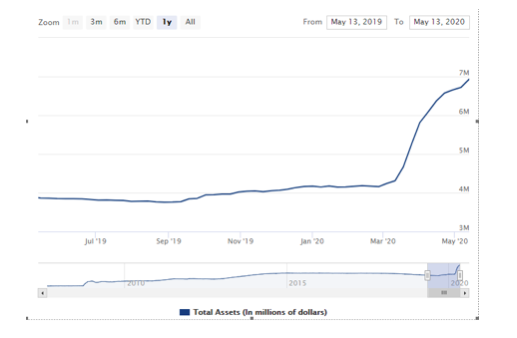
But what does that mean? Well every day, the Fed goes out and buys $50 billion of bonds, mostly mortgages and Treasuries. The entity selling them those $50 billion of bonds needs to rebalance their portfolio. They take a portion of that $50 billion of cash and maybe buy corporate bonds or junk bonds. The rebalancing effect continues so that the person who sold the corporate bonds in turn purchases stocks. If the transmission mechanism begins to break down, the Fed can directly buy baskets of corporate bonds (which they've started to do) or even baskets of stocks (which the Bank of Japan has done). If financial markets become rocky, the Fed is prepared to do even more, as Chairman Powell made clear on in a recent "60 Minutes" interview:
PELLEY: Has the Fed done all it can do?
POWELL: Well, there's a lot more we can do. We've done what we can as we go. But I will say that we're not out of ammunition by a long shot. No, there's really no limit to what we can do with these lending programs that we have. So there's a lot more we can do to support the economy, and we're committed to doing everything we can as long as we need to.
In summary, the relationship between markets and the economy in normal times is close to nonexistent. Prior to COVID, the relationship was weakening further due to the composition of the equity markets. Post COVID, the gap has become wider still, and thanks to the central banks, there is no reason to expect that the relationship will become appreciably tighter in the near future.
Related: The Major Stock Index Does Not Reflect the Economy… or Even the Stock Market