
I must confess that when I started these updates in February, I did not expect to be doing them in July, but a crisis is as good a time as any, to learn new lessons and relearn old ones. As the virus makes a comeback, particularly in the United States, it is not surprising that markets reflect the uncertainty that we all feel about how the rest of the year will play out in both our personal and business lives, with mood rising and falling on positive and negative news stories. In this post, I will begin by updating the numbers for markets overall, and within the equity market, across regions, sectors and industries. I will then use the differences I see across companies to highlight flexibility in investing, operating, financing and cash return policies as the one quality that seems to be separating the winners from the losers in these last few months, and argue that this represents an acceleration of a longer term shift towards more nimble and adaptable business models.
Market Update
If you have been reading all of my viral market updates during this crisis, I admire your fortitude, and I know that you will get a sense of deja vu, as you read this section, since I follow the same road map on each of them. I start, as always, by looking at US dollar returns on selected equity indices around the world:
|
|
| Download data |

Looking at the entire time period (2/14-6/26), US equity indices have done better than European equity indices, with a strong rebound from the lows of March 20 allowing for a complete recoupment of losses in the NASDAQ and an almost complete retracing for the S&P 500. Asian equities have diverged, with Japan and China performing better than India. As equities have seesawed, US treasury bonds have stabilized, after a steep drop in yields in the first four weeks of the crisis:
|
|
| Download data |

The treasury rates have settled in, at least for the moment, at close to zero at the short end of the maturity spectrum and at about 0.65-0.75% for the 10-year bonds and 1.2-1.4% for 30-year bonds. I know that there is a widely held view that it is the Fed that has engineered the rate drop, but note that much of the decline occurred before the Fed made its quantitative easing announcements in mid-march. I think that the Fed’s real impact has been on private lending, with its March 23rd announcement that it would operate as a backstop in corporate bond and lending markets. You can see the effects of that announcement on default spreads for corporate bonds, across ratings classes:
|
|
| Download data |

Note the climb in default spreads between February 14 and March 23, with investment grade (BBB) rated bonds almost tripling during that period, and the pull back in spreads since, to end at levels higher than on February 14, but well below the March 23rd levels. Mirroring the changes in the price of risk in the corporate bond markets, the price of risk in equity markets (measured with an implied equity risk premium) has been on a wild ride, rising dramatically between February 14 and March 23, before sliding down towards pre-crisis levels:
|
|
| Download data |

At one level, the fact that equity risk premiums are above 5% and well above historic norms (4.86% between 2000-2019 and 4.20% between 1960-2019) may seem comforting, but there is a disconcerting component to these expected values. The equity risk premium of 4.83% on February 14 was earned on top of a ten-year bond rate of 1.59%, yielding an expected return of 6.42% on equities, already low by historic standards. The equity risk premium of 5.23% on June 30 was earned over and above a ten-year bond rate of 0.66%, yielding an annual expected return of 5.89% on equities for the long term, a number well below the 7-8% that investors were pricing stocks to earn during much of the last decade. Paraphrasing Winston Churchill, equities don't look good as an investment class, until you compare them to the alternatives.
Looking at oil and copper, the two economically-sensitive commodities that I have tracked through this crisis, the divergence between the two remains, with oil prices down almost 30% since February 14 and copper prices up 4.31% since that date:
|
|
| Download data |

Finally, I keep tabs on gold, a crisis investment of long standing, and bitcoin, a more recent entrant into the game.
|
|
| Download data |

If this were a contest for a crisis asset, gold wins by a knock out, since bitcoin, at least during this crisis has moved with stocks, dropping more than 50% between February 14 and March 20 and rising more than 70% from its lows after March 20. It is possible that bitcoin can still live up to the promise of being a good currency, but it has not even come close to being one yet, snd if you are a Bitcoin advocate, you have your work cut out for you.
Equities: An Overview
I stick with my practice of downloading the market capitalizations of all publicly traded companies in the world, and then computing aggregated changes in value by groupings. In my first grouping, I look at how equities have performed across the regions of the world:
|
|
| Download data |
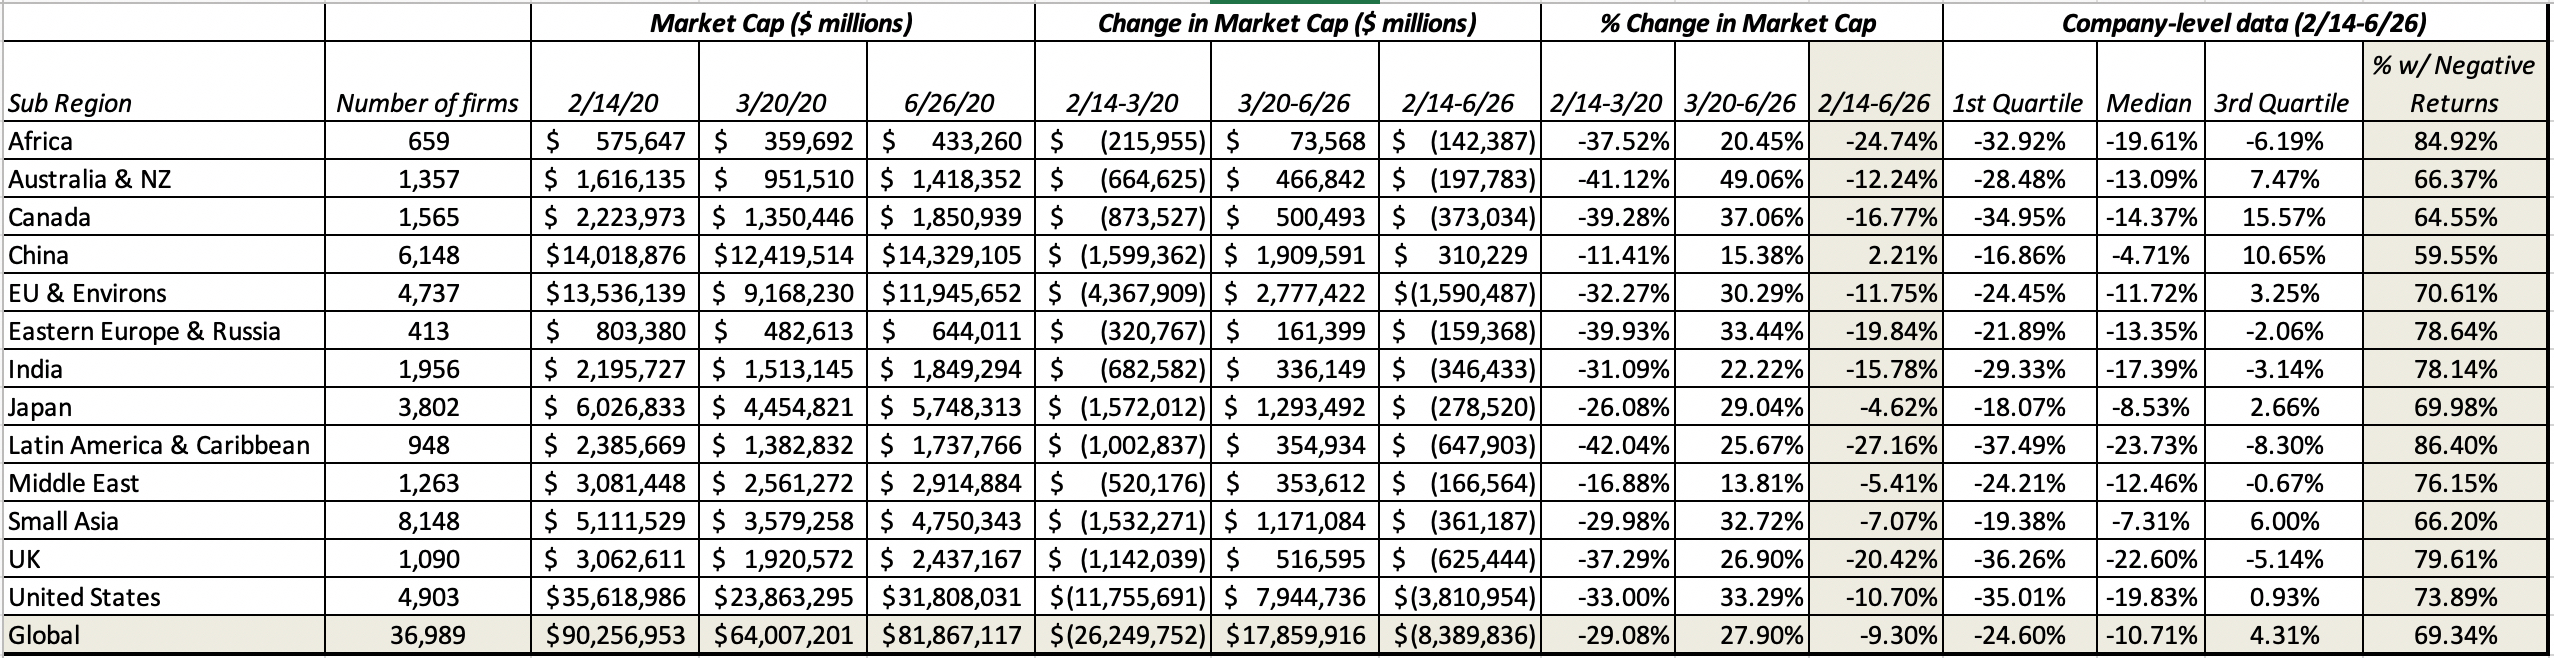
Looking at percentage change in aggregate market capitalization between February 14 and June 26, global equities have lost 9.30% of their value ($8.4 trillion), but that is quite a comeback from the 29% loss ($26.3 trillion) recorded on March 20. Emerging markets in Africa, Latin America and Eastern Europe show far more damage than developed markets over the entire period (February 14-June26), though the UK is an exception, down almost 20%. Breaking down the market action by sector:
|
|
| Download data |
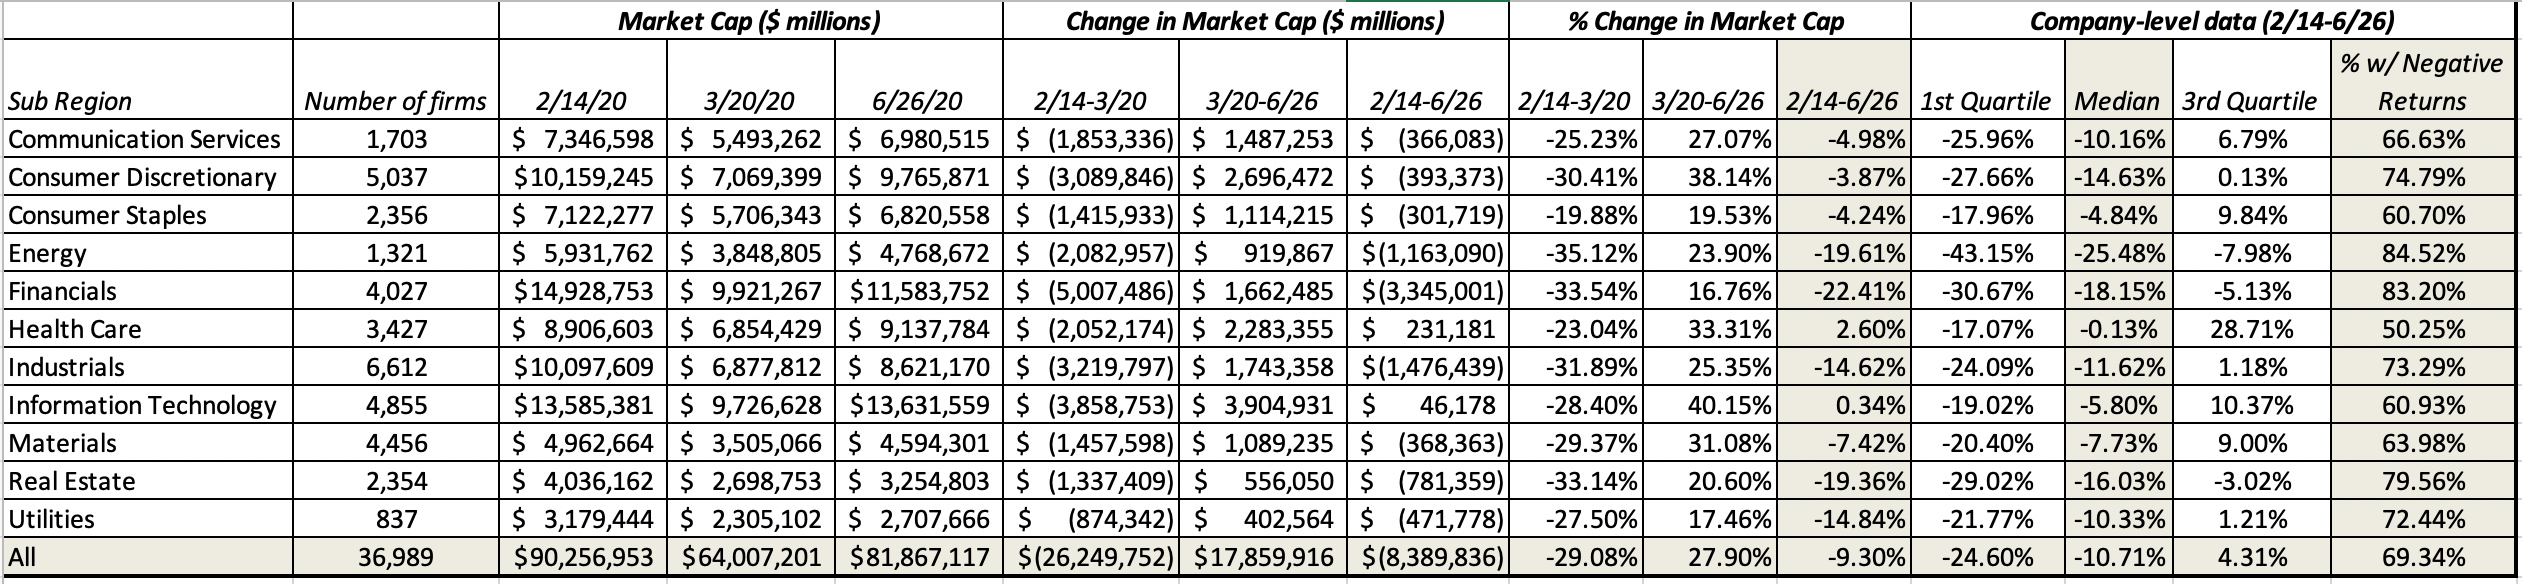
If you were primarily invested in technology and health care, your reaction to the crisis might be "What crisis?", since those sectors are now ahead of where they were on February 14, and consumer product companies (both discretionary and staple) are not far behind. Energy and real estate have lagged the market, as have utilities, but financials remain the worst performing sector remains. If you look at the last four columns, you can see that even in sectors that have held their own during this period, the recovery has been uneven, with more stocks down than up in every sector. Finally, I break down sectors into industries, and list the ten worst and best performing, in terms of market cap change from February 14 to June 26:
|
|
| Download data |

As in my prior week updates, there is a preponderance of infrastructure and financial services in the worst performing industry list, and a dominance of health care and technology on the best perfuming list. Education is a new entrant into the best performing list, perhaps reflecting the promise and potential of online education.
The Flexibility Story
As the market makes its way back from its lows, it remains an uneven one, with wide divergences between winners and losers, and in my earlier posts, I have looked for clues in the data. In my fourth post from March 23, I noted that heavily indebted companies have under performed companies with lighter debt loads, and in my eighth post from May 13, I highlighted the fact that growth stocks are outperforming value stocks. In my last post from June 19, I used the concept of a corporate life cycle, and noted that younger companies seems to be doing much better than older companies. Others have noted that capital intensive businesses seem to have been worse affected during this crisis than capital-light businesses, and early in the crisis, buybacks were highlighted as a reason why some companies and sectors were doing worse than others. In fact, the new buzzword that business consultants are pushing is "resilience", arguing that the resilient companies have weathered this crisis better than the rest of the market. While there is some truth in all of these contentions, I would argue that if there is one quality that ties together all of these seemingly disparate factors, it is flexibility, and this crisis has reaffirmed the value of flexibility.
Flexibility across the Business Model
Simply put, the flexibility of an organization measures the speed and cost with which it responds to changed circumstances, with more flexible firms adjusting faster and at lower cost than less flexible firms. That definition, though, encompasses a range of actions that stretch across every aspect of business, covering everything from how investments are made, to how the business is operated, to how it is funded, and finally to how much cash is returned to owners (in the form of dividends and buybacks).
a. Investment Flexibility
To grow, businesses have to reinvest and investment flexibility measures how much they have to reinvest to deliver a given growth rate, and how long it will take for the investment to pay off.
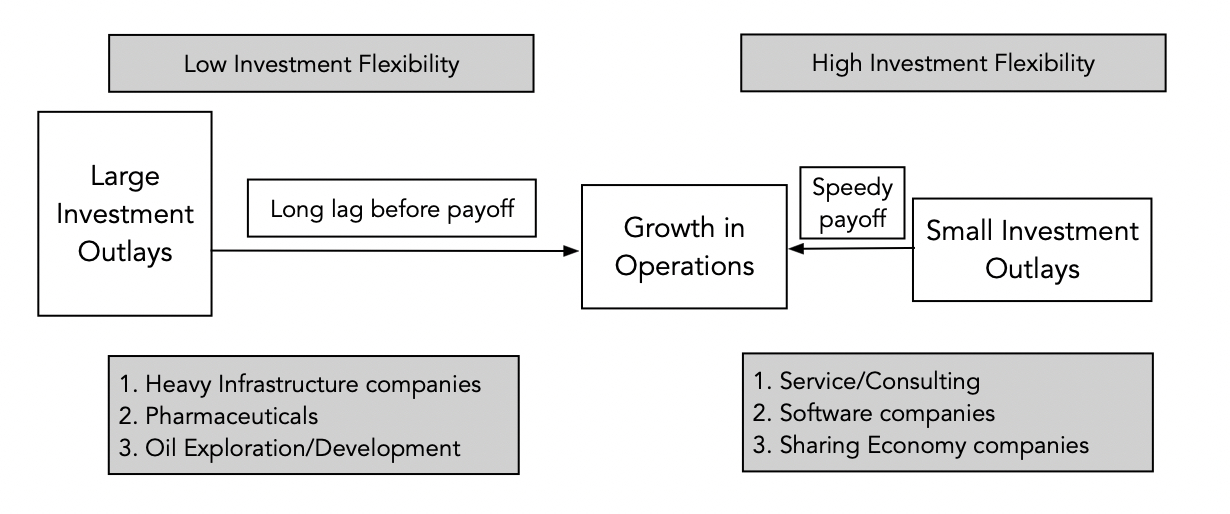
While it is true that companies that are in businesses that require heavy infrastructure investment (toll roads, telecommunications, automobiles) have low investment flexibility, and service and software firms generally have high investment flexibility, the divide is not necessarily on whether the investments are in tangible or intangible assets. Pharmaceutical companies, for instance, have low investment flexibility because they have to spend large amounts in R&D, with significant leakage (as some R&D will not pay off) and have to wait long periods before commercial success. Over the last decade, disruption in many businesses with a history of low investment flexibility has come from new entrants with business models that allow them to scale up quickly, with relatively low investment. Uber and Airbnb are examples of sharing economy companies that have had a decisive advantage this dimension over their established competitors. To see how this crisis has played out on the financial flexibility dimension, I classified all non-financial service companies listed globally, based upon the ratio of sales to invested capital, on the (questionable) assumption that invested capital (computed from the accounting balance sheet values of debt, equity and cash) measures reinvestment, into ten deciles:
|
|
| Download data |
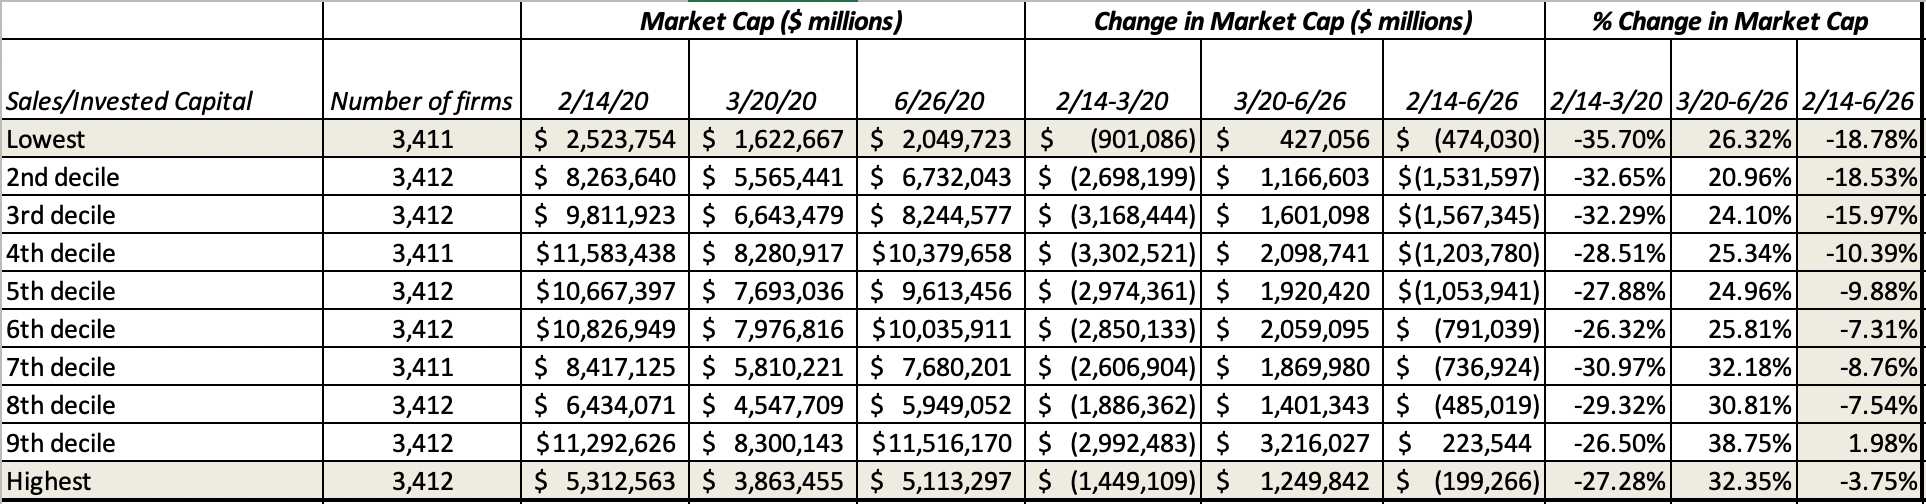
Note that companies that can generate the most revenues per dollar of invested capital are signaling the highest investment flexibility and they have done far better during this crisis than firms that are in lowest decile of this measure. Some of this may be spurious correlation, but it is an interesting first take on how investment flexibility has been treated by the COVID market.
b. Operating Flexibility
During the course of operations, businesses will be hit by shock that cause their revenues to unexpectedly increase or drop, and operating flexibility measures how those revenue changes flow through into operating profitability. The key to decoding this effect is to break down the operating expenses of a company into fixed and variable, with the latter moving up and down with revenues, while the former stays fixed:

Companies with high fixed costs, as a percent of revenues, will see much more dramatic swings in operating income, as revenues change, than companies that have more flexible cost structures. It is not surprising, therefore, that airlines have wild swings in profitability from good years to bad ones, whereas online retailers and service businesses have more muted effects. To see how operating flexibility has played out in this market, I would have liked to have broken costs down into fixed and variable for all companies, but lacking clean accounting measures of either, I settled for gross profit margins, on the assumption that companies with high gross margins have far more flexibility in dealing with revenue shocks than companies with low margins. Breaking down companies based upon gross margin into deciles, here is what I find:
|
|
| Download data |

With a full admission that gross margin is a flawed measure of operating flexibility, companies with higher gross margins have done better than companies with lower gross margins, as this crisis has unfolded.
c. Financing Flexibility
As revenues go up and down, and operating income tracks those changes, financial flexibility measures how much net income (to equity investors) is altered, with firms with low financial flexibility showing much bigger swings in net income for a given change in operating income. The key drivers of financial flexibility are debt obligations and cash holdings, with the interest expenses on the former pushing up net income volatility, and the interest income from the latter dampening that volatility:
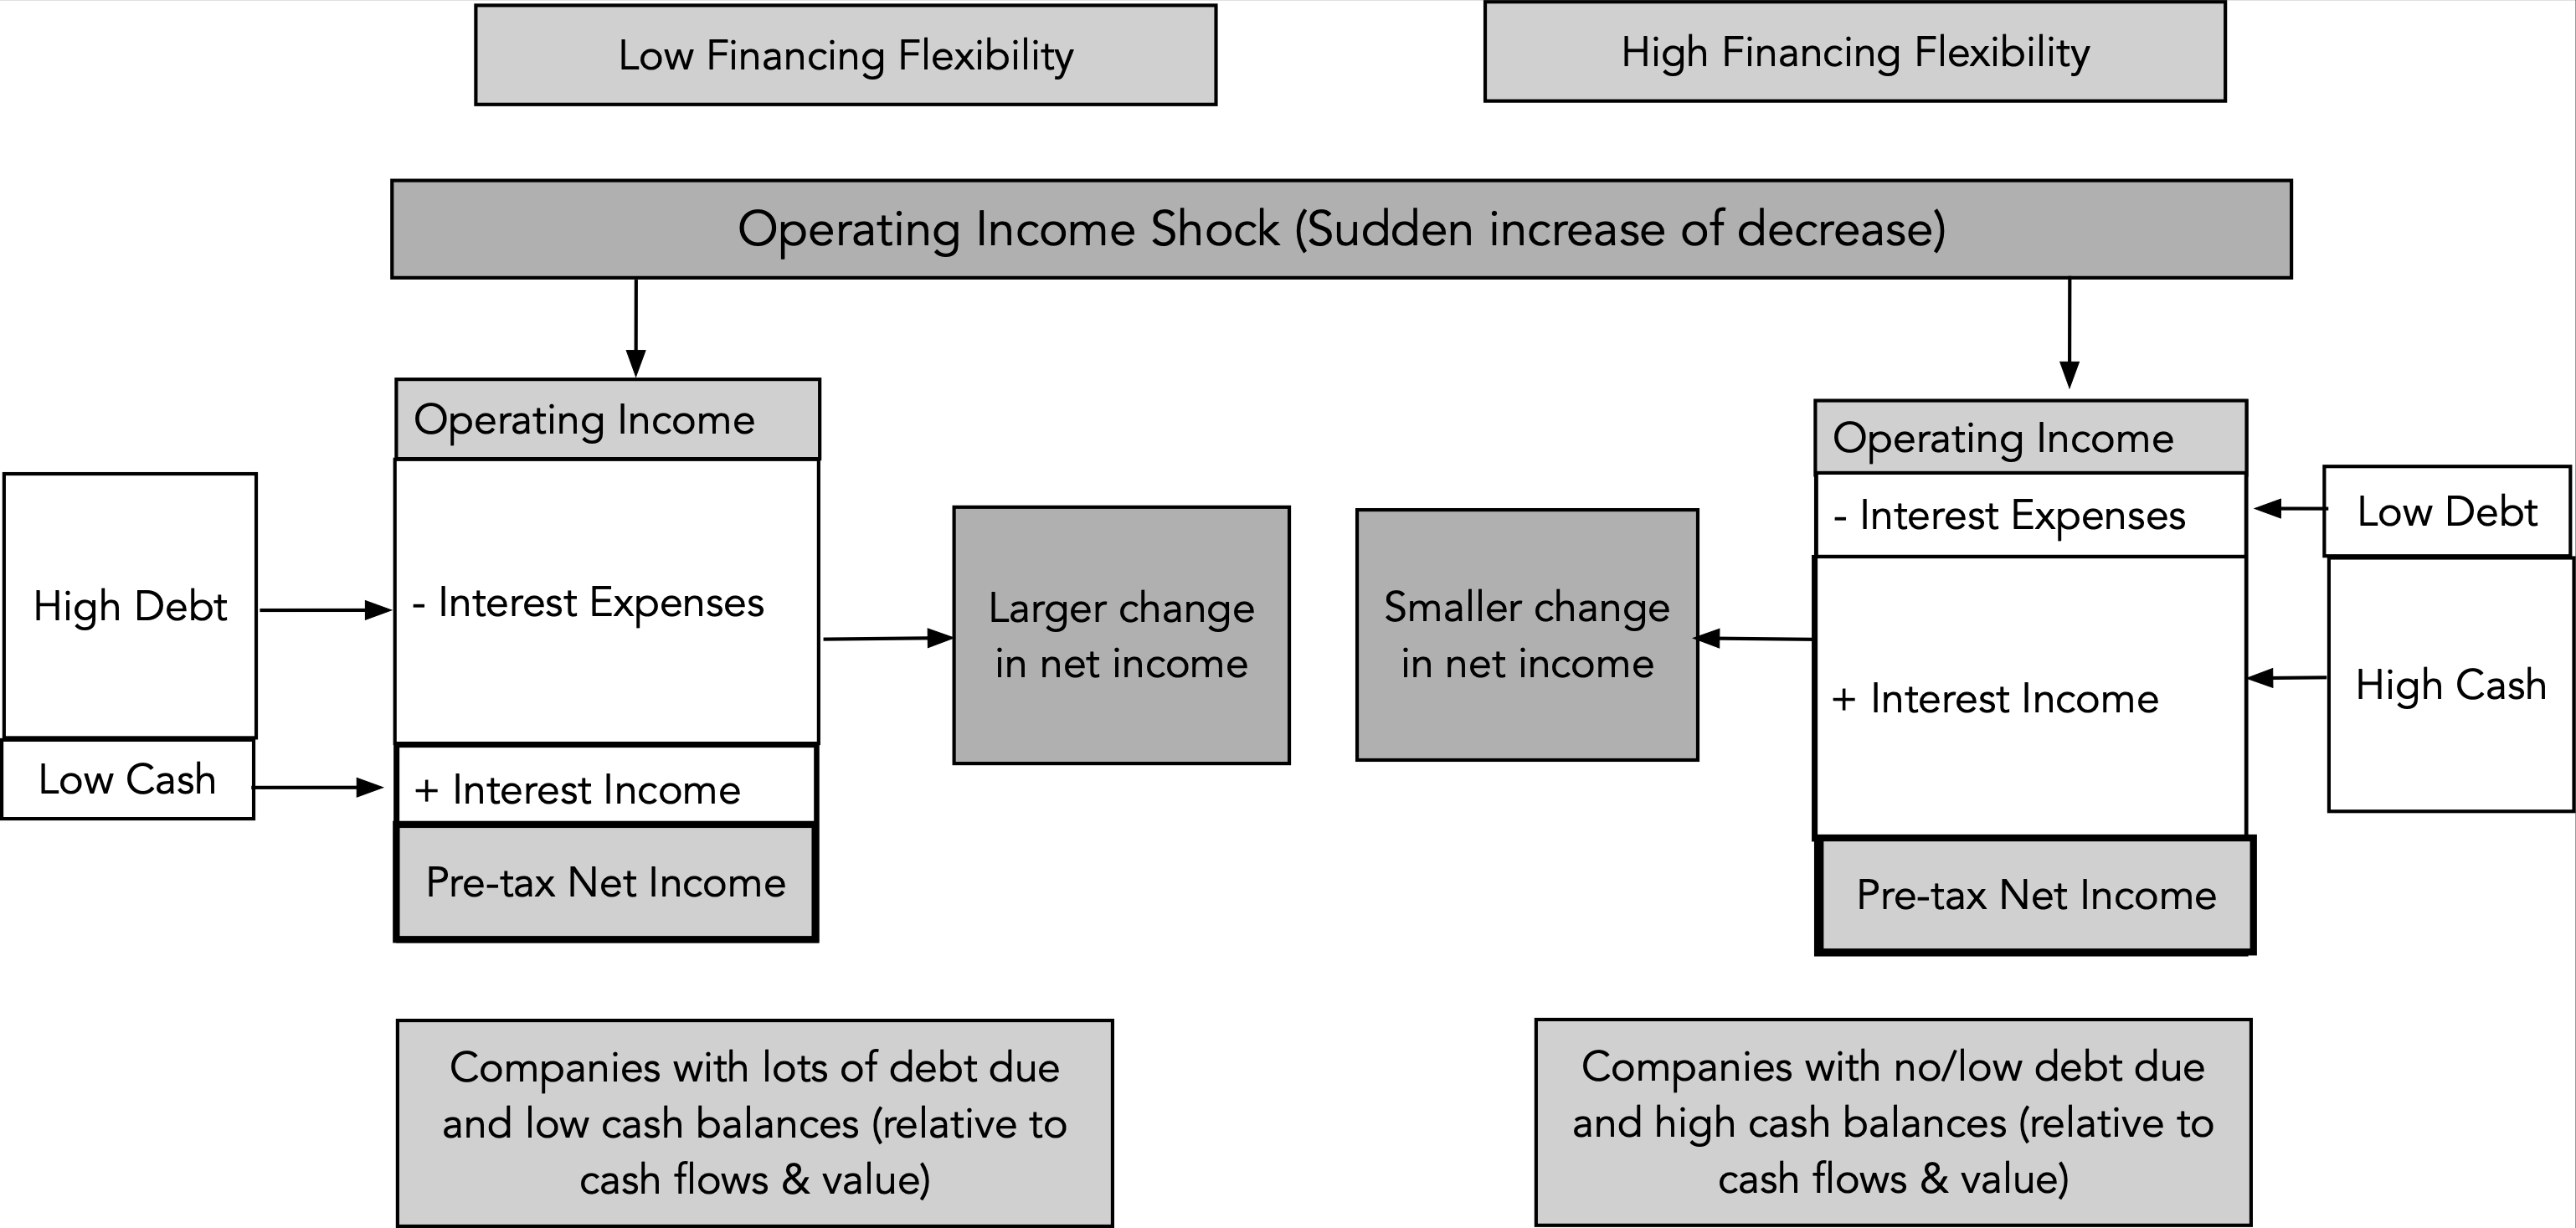
If net debt, as a percent of cash flows or value, is the driver of financial flexibility, we can see how financial flexibility has played out in this crisis by breaking companies down into deciles based upon Net Debt as a multiple of EBITDA:
|
|
| Download data |

Companies with high net debt ratios have low financial flexibility and they have been damaged far more than companies with low net debt ratios. Note that the lowest decile of net debt ratios includes firms that have negative net debt, i.e., cash balances that exceed the debt, and they show an increase in market capitalizations between February 14 and June 26.
d. Cash Return Flexibility
The end game, when investing in publicly traded company stocks, is to collect cash flows from that investment, and companies have two choices when it comes to returning cash. The conventional approach has been to pay dividends, but over the last three decades, US companies in particular have turned to returning cash in the form of buybacks. Both dividends and buybacks have to be funded by cashflows to equity investors, and cash return flexibility measures how quickly companies can adjust their cash returns to reflect changes in cash flows to equity:

Obviously, companies that return little or no cash, relative to their free cash flows to equity, are not only accumulating cash, but have far more cash return flexibility than companies that return a large proportion of their cash flows. Since dividends still remain the primary mechanism for returning cash across the world, I start by looking at dividend yield, classified into deciles, and looking at the market action in each decile for global companies:
|
|
| Download data |
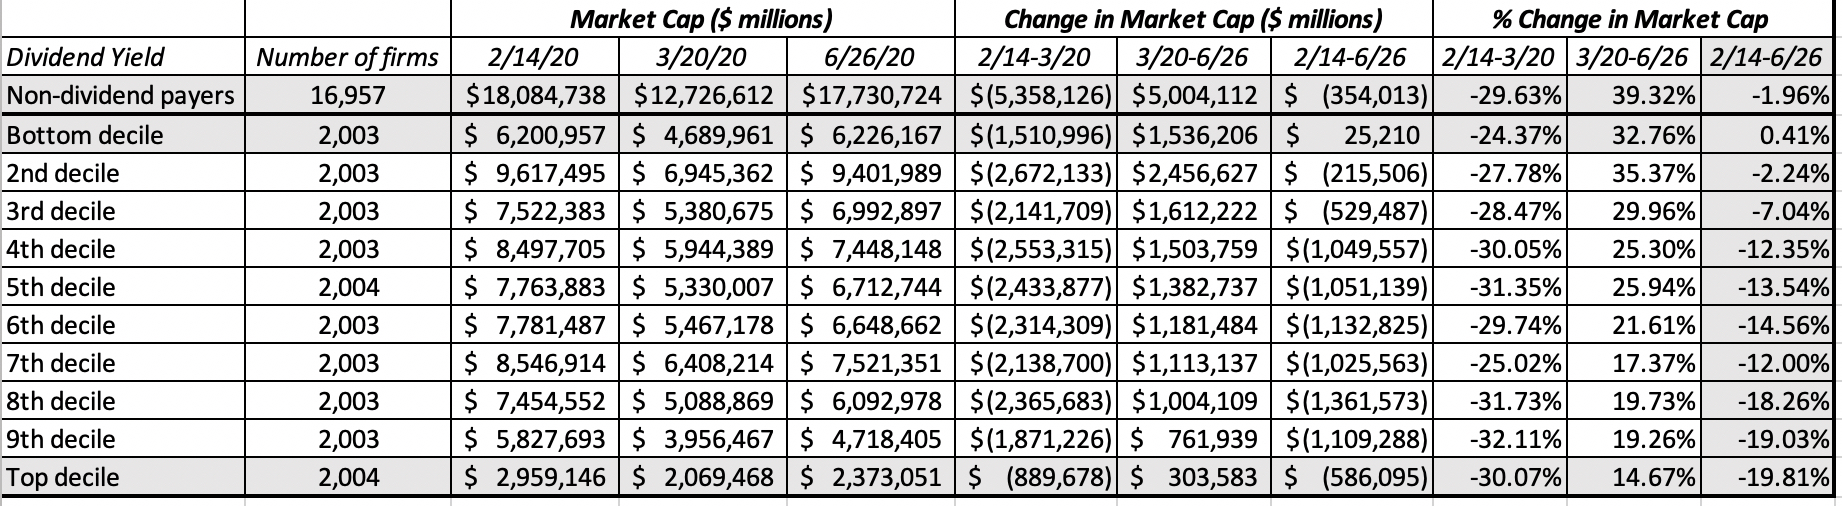
Clearly non-dividend paying stocks and stocks with low dividend yields have done much better than companies with high dividend yields. Among companies that do return large portions of cash, those that return the bulk of their cash flows in the form of dividends have far less flexibility than those that buy back stock, mostly because dividends are sticky, since once they are initiated and set, companies are reluctant to change them. To examine whether the mode of cash return has been a factor in the market action, I break companies into four groups based upon whether they pay dividends and/or buy back stock:

While companies that pay both dividends and buybacks have been worst affected and companies that use neither have performed the best over the period, isolating only companies that pay only dividends or buy back stock, companies that pay only dividends have under performed companies that buy back only stock. While the results are only indicative, they do suggest that making buybacks the bogeyman in this crisis is not backed up by the evidence.
Implications and Conclusion
During this crisis, markets have rewarded flexible companies, a continuation of a trend that predate the crisis to the last one. If the last decade has been a disruptive one, that disruption has been largely driven by companies that have not only built flexible structures, but also used that flexibility to gain competitive advantages over their status quo competitors. As companies get pushed to increase flexibility, it is worth noting that this quest comes with costs, and these trade offs have to be acknowledged:
1.Compressed Corporate Life Cycle: Earlier in this post, I argued that one of the benefits of having high investment flexibility is that companies can scale up faster; Uber and Airbnb have been able to go from start ups to large companies (at least in terms of operations and value) in very short time periods. However, the same forces that allow these companies to scale up faster also create business models which are more difficult to defend against new competitors, leading to shorter periods of maturity and more speedy decline, with important consequences.

2. Losses on the upside: With operating and financial flexibility, the trade off is much simpler, since companies with greater operating and financial flexibility will be more protected on the downside, but at the expense of giving up some of the upside. Having large fixed costs and/or high net debt will result in bigger losses when times are bad, but it will also create larger profits on the upside.
3. Social costs: As new business models are built to have motor flexibility, some of the actions that increase flexibility come with costs that are borne by society, rather than the company. For instance, Uber's business model of treating drivers as independent contractors rather than employees gives the company a more flexible cost structure, but it does pass on the costs of providing a safety net (health care and pensions) to society. As a society, we need to debate whether the benefits we gain by having a more nimble economy outweigh the social costs.
Data
- Market data (June 26, 2020)
- Regional breakdown - Market Changes and Pricing (June 26, 2020)
- Country breakdown - Market Changes and Pricing (June 26, 2020)
- Sector breakdown - Market Changes and Pricing (June 26, 2020)
- Industry breakdown - Market Changes and Pricing (June 26, 2020)
- Investing Flexibility (Sales to Cap) breakdown: Market Changes and Pricing (June 26, 2020)
- Operating Flexibility (Gross Margin) breakdown: Market Changes and Pricing (June 26, 2020)
- Financing Flexibility (Net Debt Ratio) breakdown: Market Changes and Pricing (June 26, 2020)
- Cash Return Flexibility (Dividend Yield) breakdown: Market Changes and Pricing (June 26, 2020)
Related: A Corporate Life Cycle Perspective on Current Markets