
Yesterday, I highlighted the seesaw nature of the S&P 500 grind just in time for the intraday bear raid to hit. How much of a damage has it done, should we pay attention to hanging man candlestick? My article discussed not so smooth sailing ahead in the month of February. Muddling though, yes – start of a real correction, no.
Why should it be on the immediate horizon anyway? Quoting my yesterday‘s analysis:
(...) The Fed‘s foot is back on the pedal, but inflation hasn‘t reared its ugly head yet – the path of least resistance for stocks remains higher. Unless the corona vaccination programs disappoint the markets, hurting cyclicals and the breadth of stock market advance, that is. Such a turn would take quite some activist economic policy steps to counter, as you can imagine.
In today‘s article, I‘ll shine light upon yesterday‘s tremors, and the S&P 500 sectoral outlook, demonstrating that we‘re merely experiencing another rotation within the ongoing stock bull market. And the stock pickers will also benefit.
Now that you know what‘s up, let‘s dive into the technicals (charts courtesy of www.stockcharts.com).
500 Outlook
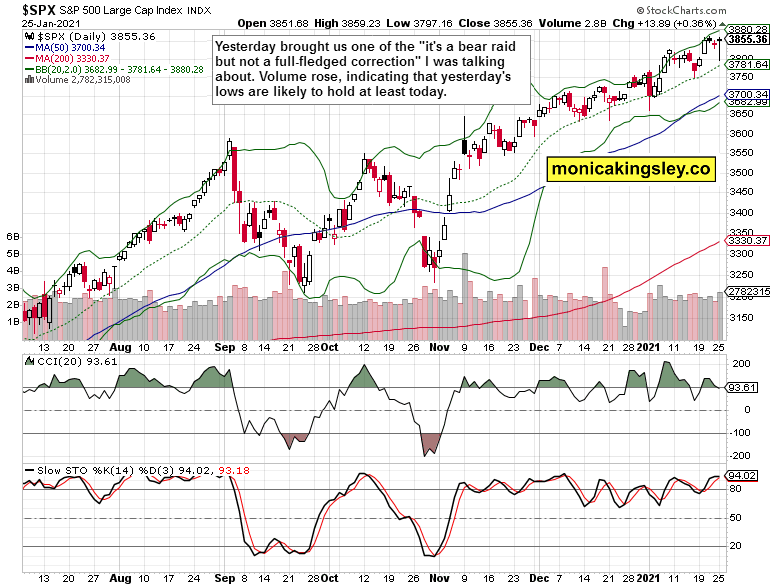
Lower, lower knot with the bears temporarily flexing their muscle before the bulls stepped in. Improving volume shows a certain degree of conviction, which is a welcome sign for today‘s session. While the daily indicators are extended, they don‘t support any call for a great rollover to the downside.
My yesterday‘s words are valid also today, with us having seen the opening push lower already:
(...) The daily indicators seem to favor largely sideways to mildly higher trading action in the nearest days. That‘s one point of view, with the other being that prices haven‘t declined enough to lure in the buyers yet. Given the volume examination, I lean towards sideways trading coupled with an unsuccessful push lower as the most probable scenario over the coming 1-2 weeks. Then, higher prices.
Markets
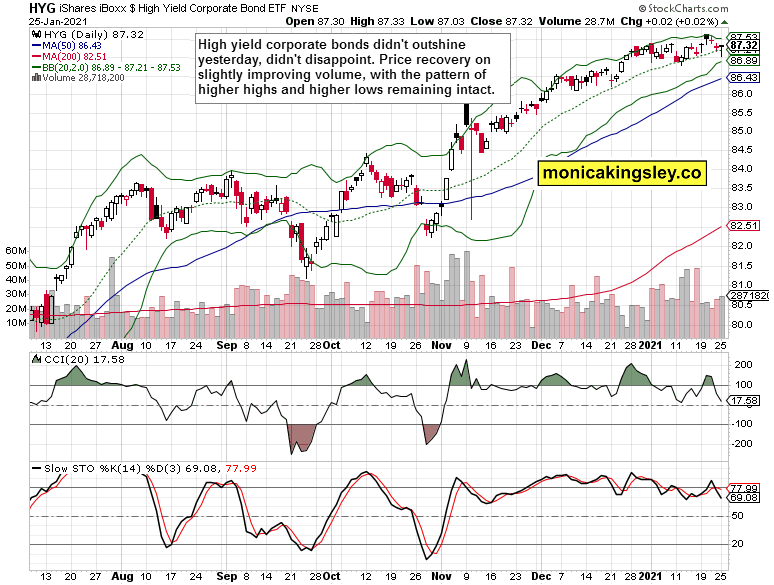
High yield corporate bonds (HYG ETF) have also held ground quite well yesterday. While slowing down in pace, the ascent isn‘t broken with a lower low. Investment grade corporate bonds (LQD ETF) had a much better day yesterday.
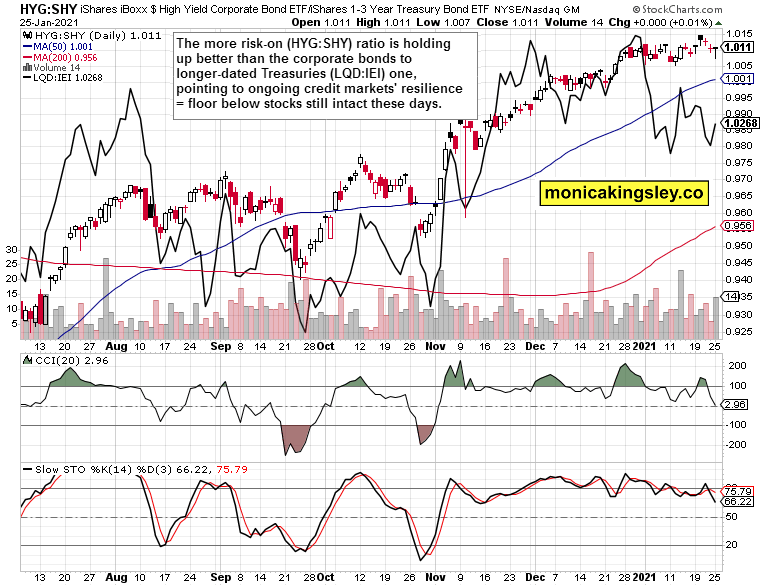
Both leading credit market ratios – high yield corporate bonds to short-term Treasuries (HYG:SHY) and investment grade corporate bonds to longer dated Treasuries (LQD:IEI) – support the stock bull market to continue. With the latter one refusing to budge yesterday, we have likely seen local lows for January already.
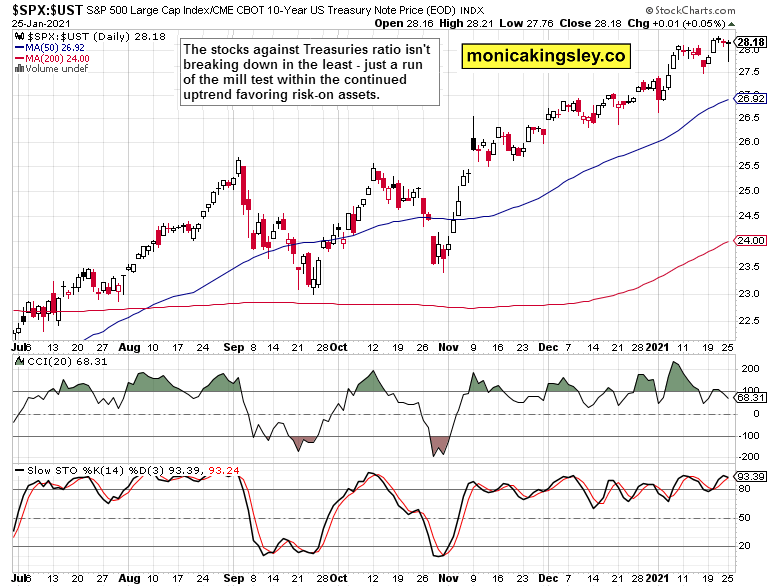
The stocks to 10-year Treasuries ($SPX:$UST) ratio shows the preference for risk-on assets as intact. The post-election performance is contained within a quite tight, upward sloping channel.
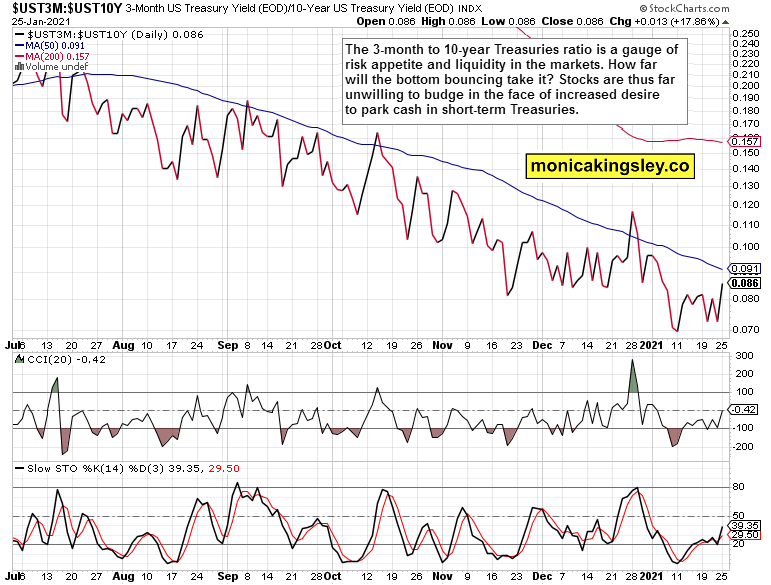
The spread between 3-month and 10-year Treasuries is telling me about increasing willingness to park funds on the sidelines. That‘s the very short-term, daily interpretation. The big picture view reveals that money is flowing away from the long end of the curve (understandably so given the surefire prospects for the return of inflation, in my view), and stocks are benefiting.
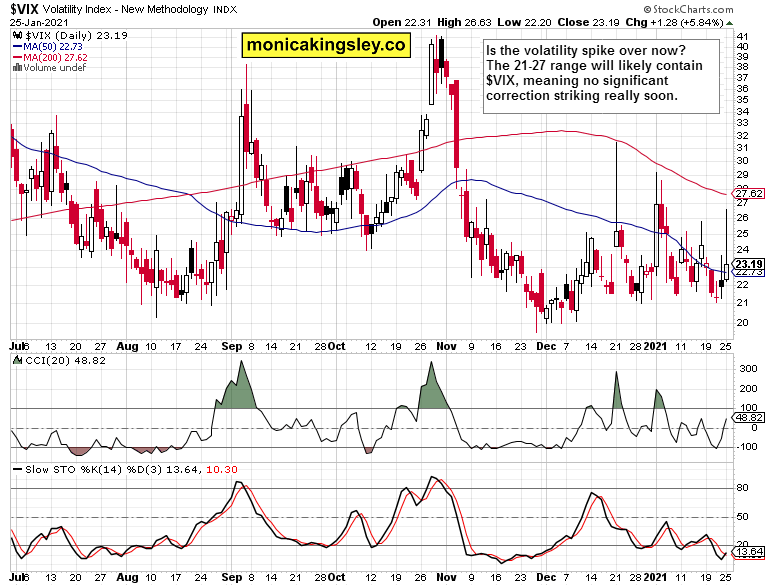
Volatility spiked yesterday before retreating soundly. Another push higher is likely to come soon, but I am not looking for it to overcome yesterday‘s highs really. I view $VIX as rangebound for the coming weeks with a spike here and there, within the pattern of lower highs.
What would make me change my mind? A new narrative replacing the current one of a spending-heavy administration making its moves hand in hand with the Fed. Hand on your heart, how likely is that this soon in the game?
500 Sectoral Performance
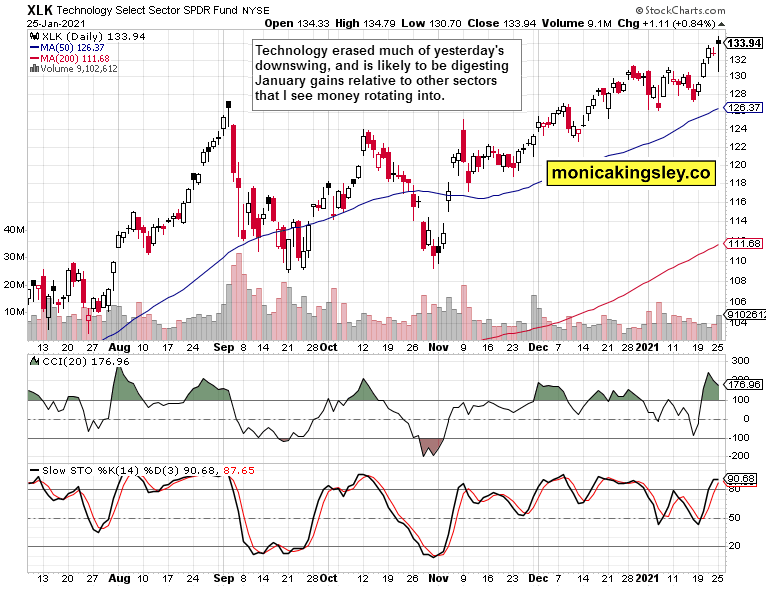
Technology (XLK ETF) smartly recovered from the intraday plunge but might not be yet out of the woods as the coming sessions would show. Considering its appreciation since the early September climactic top that I‘ve called, the sector has visibly slowed down after leading the S&P 500 from the vicious bear market bottom on March 23.
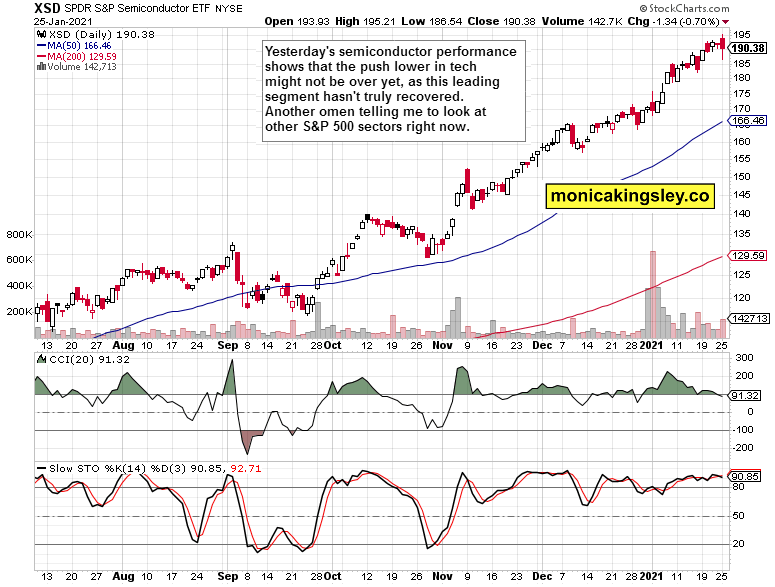
Semiconductors (XSD ETF) belong among the leaders too. While they have performed much stronger than technology since Sep 03, they haven‘t recovered the daily setback to the same degree. Still, they keep trading within their steeper upward sloping channel comfortably thus far. Even after a one way elevator ride, a period of consolidation sooner or later comes, and we might be on the doorstep of one here.
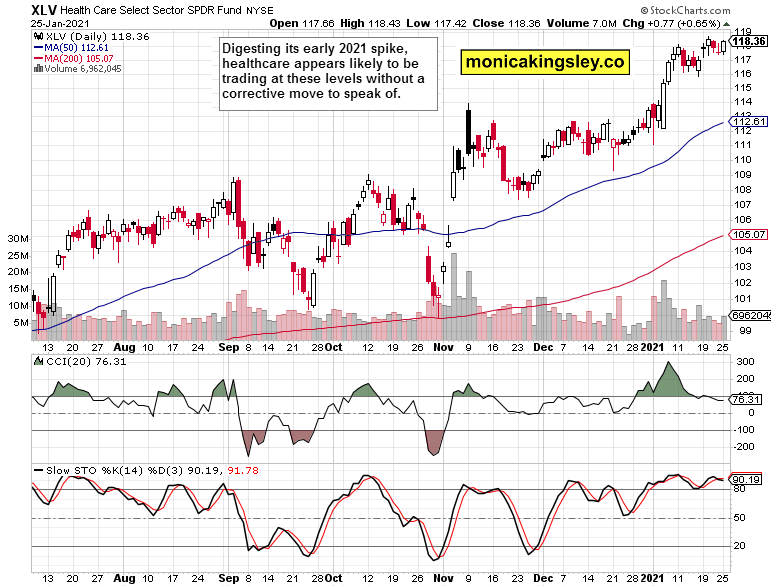
Healthcare (XLV ETF) is the second S&P 500 sectoral heavyweight, and it keeps doing fine. Pushing higher, being among the better performing sectors recently, which is supported by its internals. Enter biotech.
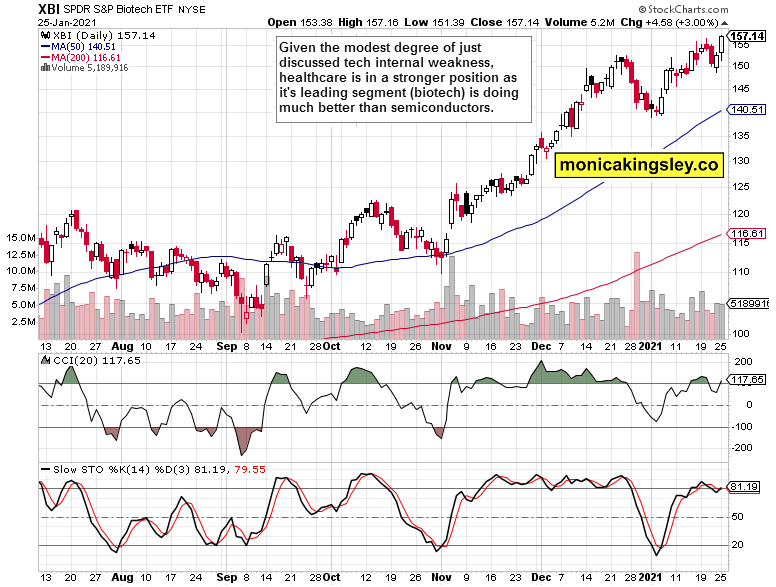
What semiconductors are to tech, biotech (XBI ETF) is to healthcare. And this leading segment continues to outperform healthcare as a whole, which bodes well for the S&P 500 as such.

Financials (XLF ETF) are the third heavyweight, and appear to be done in the very short run with their corrective move. That‘s the message of rising volume and long lower knot to me.
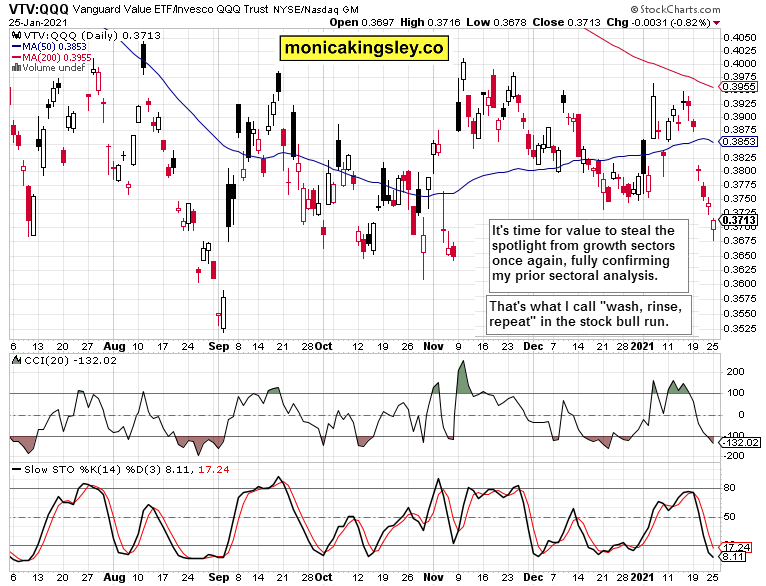
The value to growth sectoral ratio (VTV:QQQ) shows we‘ve reached levels consistent with another rotational wave into growth. Just look at the sectors trading with low price/book and price/earnings ratios, and you‘ll see the defensives (utilities, consumer staples), financials and real estate rebounding. Materials, industrials and energy are also ready to rebound, displaying the same price patterns as financials.
Summary
A sharp intraday correction has come and gone, and the tech performance remains the key precondition of its return. And given the short-term relative weakness in the sector, the nearest days may bring another push lower that won‘t however jeopardize the bull market in the least.
Related: Rosy February for S&P 500? Not So Fast
DISCLOSURE: The views and opinions expressed in this article are those of the contributor, and do not represent the views of Advisorpedia. Readers should not consider statements made by the contributor as formal recommendations and should consult their financial advisor before making any investment decisions. To read our full disclosure, please click here.