
Recent stock market gyrations “bear” a striking resemblance to “Black Monday”
The global stock market has sent us a warning. Play time is over. Speculators will be punished, and oversimplified investment approaches based on “being a long-term investor,” “buying the dips,” and “don’t worry, it will come back” are all now threatened.
Even with all I have studied in the markets for the past 30+ years, I was surprised to hear that this was the fastest 10% drop in the U.S. stock market in about 70 years. That prompted me to think back to my second year in the investment business, 1987. The market crash on Monday, October 19 of that year brought the financial system to its knees in a way not seen since the crash of 1929, and not until the Financial Crisis a decade ago.
That day was the culmination of a period of speculative excess that dropped the S&P 500 Index by 33% in under 2 months. 22% of that decline occurred on that October Monday in ‘87.
Back in October of 2018, I wrote a piece here at Forbes.com that recalled the 1987 crash. I noted that the market of late 2018 was moving in a very similar pattern to that of late 1987. Not long after that, the S&P had a mini-crash of about 15% in 3 weeks in December. But the market held, and off to races we went…until earlier this month.
The 10X growth situation
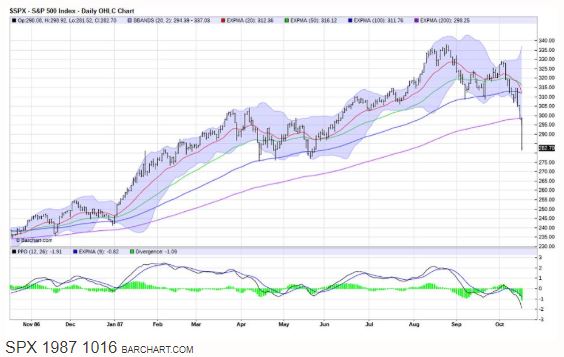
You see, the market is about 10 times higher than it was 33 years ago. So, SPY, which trades a price that is roughly the S&P 500 Index value divided by 10, is right in line with the actual S&P 500 from back then. Here is 1987, showing the S&P 500 peak around the $340 level in August. It dipped, rallied and then plunged. This chart shows where it had fallen to on the Friday prior to the Crash of 1987.
1987 – through Friday, October 16
Now, here we are again. As if to taunt investors further, the level of the S&P 500’s price back then are nearly identical to the price pattern of the big ETF that tracks the S&P 500, symbol SPY, shown here.
2020 – through Friday, February 28
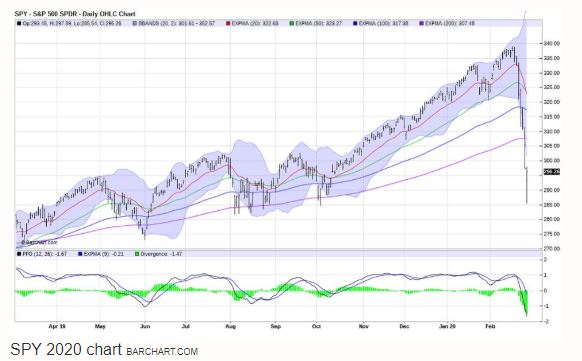
The S&P 500’s price pattern since the recent peak (around $340 in the SPY, which is about $3,400 on the S&P 500) looks a lot like the S&P 500 of late 1987. To be clear, these things never look identical. But there are many key features of this chart that should give pause to any investor or financial advisor who thinks the usual playbook is intact.
Does 2020 rhyme with 1987? Let me count the ways.
This year’s S&P 500 advance through mid-February was strong,. Then, it stopped cold. What appeared to be a routine pullback from near all-time highs fell apart in just a couple of days. Yes, the increasing recognition of the severity of the Coronavirus outside of China was the “headline” impetus for that market top. However, as I have been writing for 2 years here, the market was priced for perfection.
It doesn’t take much to pop a huge bubble. Coronavirus did that, in the way that if you drink 20 beers and then after drinking the 21st, you pass out, you can’t blame beer number 21 for that. The condition prior to number 21 that built up and was ignored landed you there.
For chart geeks only
From a chartist’s standpoint, the S&P 500 sliced through 4 different “moving averages” (the 4 colored lines in the top part of the chart) very quickly. The so-called “PPO” indicator, shown in the bottom part of the chart, had nearly crashed a couple of times earlier in the year, but each time it rallied just in time to extend the bull market.
But this time, the PPO appears to be nowhere near bottoming, at a level where it often does. THAT is a big risk for the “buy cheap stocks now” crowd. While we never know what will happen next, I just don’t have any hard evidence (technically speaking) that some major price bottom is upon us. That is from looking not only at the major market indexes, but at hundreds of stocks and equity-ETFs.
Risk, but not certainty
Back in October of 2018, in that other 1987-referenced article, I wrote that,
We have had many “setups” that looked somewhat like this, but this one appears different, and comes at a time when the market has many “excuses” to crater. And as we know, sometimes investment markets take on a snowball effect.
That time, investors escaped with a 20% decline in the S&P 500, that ended on Christmas Eve. I have referred to that as the first part of a hurricane for investors. Since that time, the relative calm is akin to the “eye” of a hurricane, which is the sunny period between the front and back sides of the storm. Suffice it to say, the wind is picking up again. Bigly.
1987: now you see the rest of the story
Recall that in the 1987 chart of the S&P 500 I showed you above, I only ran it through Friday, October 16. The “crash” was the following Monday, October 19. Here is that same chart, one day later.
Lest you think the chart above shows the 1987 Crash, it does not. It shows the S&P 500 leading right up to the 1987 Crash, through Friday October 16 of that year. Here is what happened next…
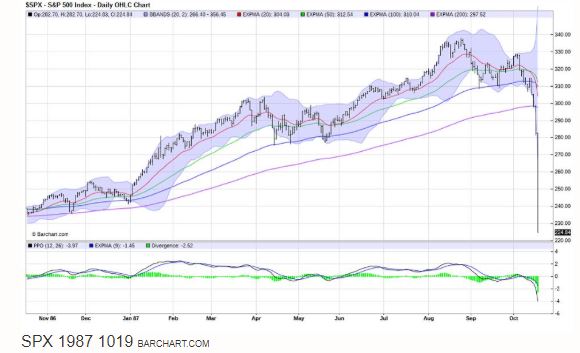
One day, 22% down, screaming headlines, panicked investors who were fear-stricken for years afterward. The good news is that by the next day, a long-term buying point was already starting to develop. However, few were emotionally ready to even see it.
Getting real
What angers me the most about the vast array of financial “experts” during times like this is that they lose sight of what folks are investing for. And, because of that, they try to pick their spots or blindly follow bull market mantras at a time when retirements are truly at risk.
Most investors are not trying to “play” the stock market. They are trying to achieve goals. And to do that, you need a process that gives strong consideration to what could go wrong. That doesn’t make me a bear, just a realist. And a fiduciary.
I will finish this the way I did back in 2018:
The S&P 500’s path in 2020 is certainly not identical to that of 1987. It just looks similar. And whether history repeats, rhymes or turns out to be completely different from this point forward is not really the key.
What is? That any investor should seek to understand in advance of market calamities what their true tolerance for volatility is. More importantly, knowing that tolerance, you should strive to put yourself in position to weather whatever market storm occurs. And, as 1987 showed us, you don’t always have the luxury of time.
Related: Why This Selloff Should Make Boomers Put All Investment Options On The Table