
The most overused expression in technical analysis? It’s a 2-horse race. Either “cup and handle” or “head and shoulders.” You can Google them to see what I’m talking about if you are not familiar with charting in depth.
I have typically dismissed a lot of the standard technical jargon and created my own path and rules about what I find interesting, attractive or dangerous in a chart. Why? Because if everyone is doing the same thing, I think there’s something missing for me: an edge. And that’s what I want as a self-directed investor, whenever I can get it.
Now, on to some charts I think matter right now
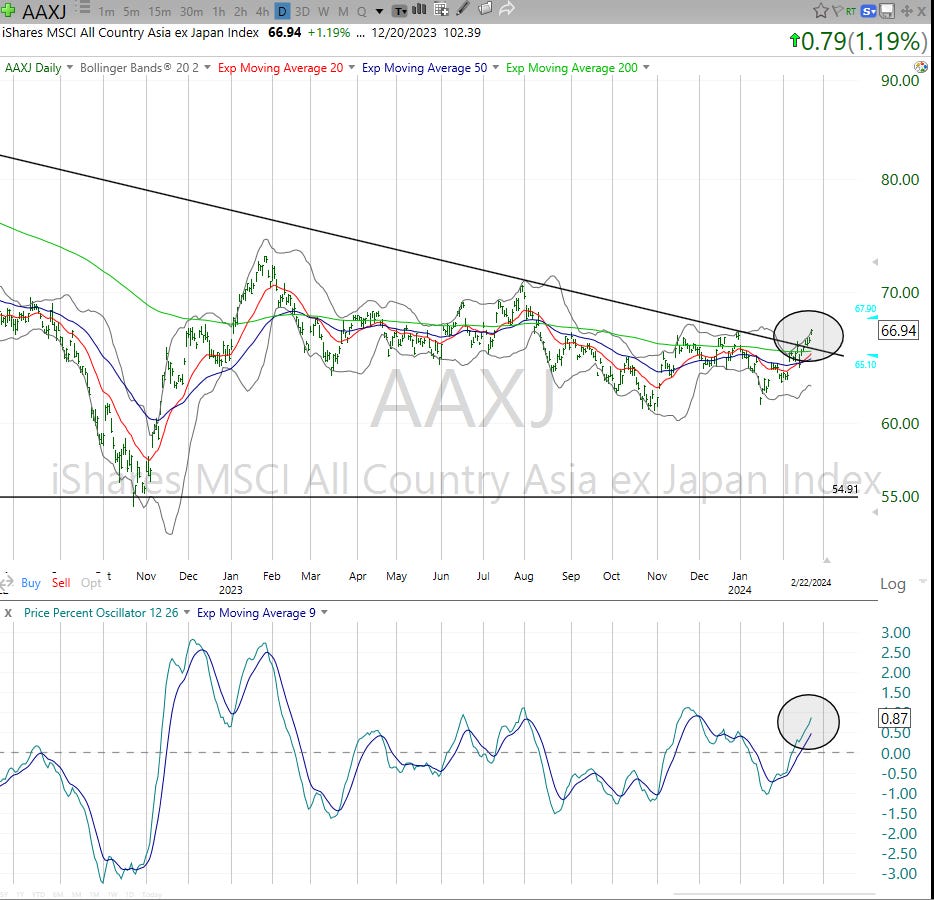
Last week I wrote this Asia ETF is soooo close to breaking out from a 3 year down trend. It’s 30% China, but India and other regional markets play a big role.
This week (chart updated through Thursday’s close): breakout. See the circles marking that “event” on the chart. Maybe not as exciting as US tech stocks these days, but I’ll take it.
 |
Is this magic? No, it’s repetition.
I’ve been seeing the same pattern hundreds of thousands of times over 38 years, and developing a process that includes guidelines about what looks like a good reward/risk tradeoff, what looks like a bad one, and which ones look “too tough” to draw an immediate conclusion about.
It is foolproof? Not one damn bit!
Investing to me is a game of percentages, of odds of success. The ROAR Score is a concept that I am glad so many of our subscribers have found to be a useful “home base” from which to make their own investment decisions using our research and any other resources they find appropriate.
Next, there’s biotech, which is a good current example of one of the conclusions I mentioned above: “too tough.” It’s trading in a range as I marked it with the horizontal lines, since more than 2 years ago. And the bottom of the chart has what my son, when interning with us several years ago, named the “dolphin” pattern because it looks like, well, a dolphin! The judges will also accept “Loch Ness Monster” as a response for what this looks like.
|
|

To me, it looks like I’d rather try to find something more defined. It is one thing to realize that even the best-looking chart patterns are not a slam dunk. It is another to not even be able to conclude the chart is buyable…or sellable.
And, after such a smashing day today, how could I not say something about QQQ? But wait, this says QQQ, but that looks like a lot of people’s time wasted. That horizontal line across the bottom of the price chart (top section) went nowhere from early 1997 to late 2022, nearly 6 years.
|
|
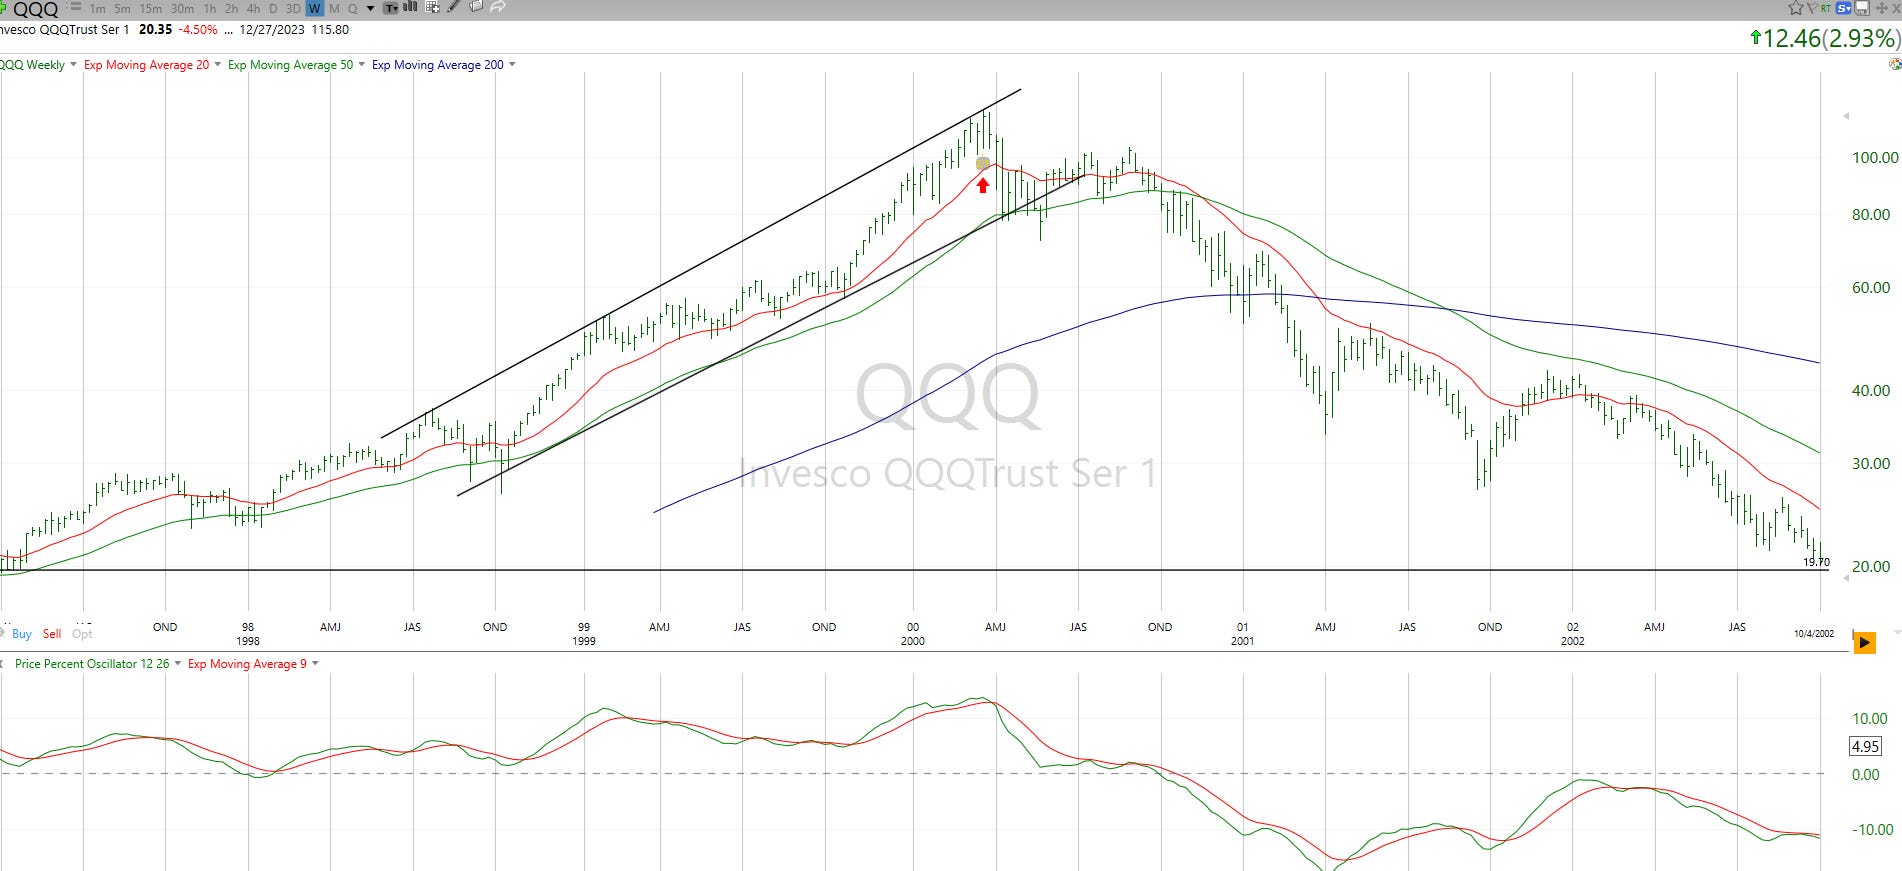
I go back to this chart in one form or another every time the market looks or feels like it did at that time. I think this is one of those times. But that doesn’t help me predict the future, only to evaluate the potential outcomes. And 2 of those are as follows:
We are early into the “melt up” phase, a la January of the year 2000. That implies potential for a monster up move that would truly be a crescendo to what we’ve already seen. If that were to come to fruition, QQQ could have another 20%-30% upside in it, easily. IF, he said.
What’s the downside target? Too early to ask, as today’s chart is unclear, other than that it has been soaring, and that all pullbacks have been buying opportunities for the risk-seekers. In 2000, QQQ topped and fell for 3 years, a total of about 78% from the peak. Some of us lived to tell about it.
Related: Where the Buys Are