
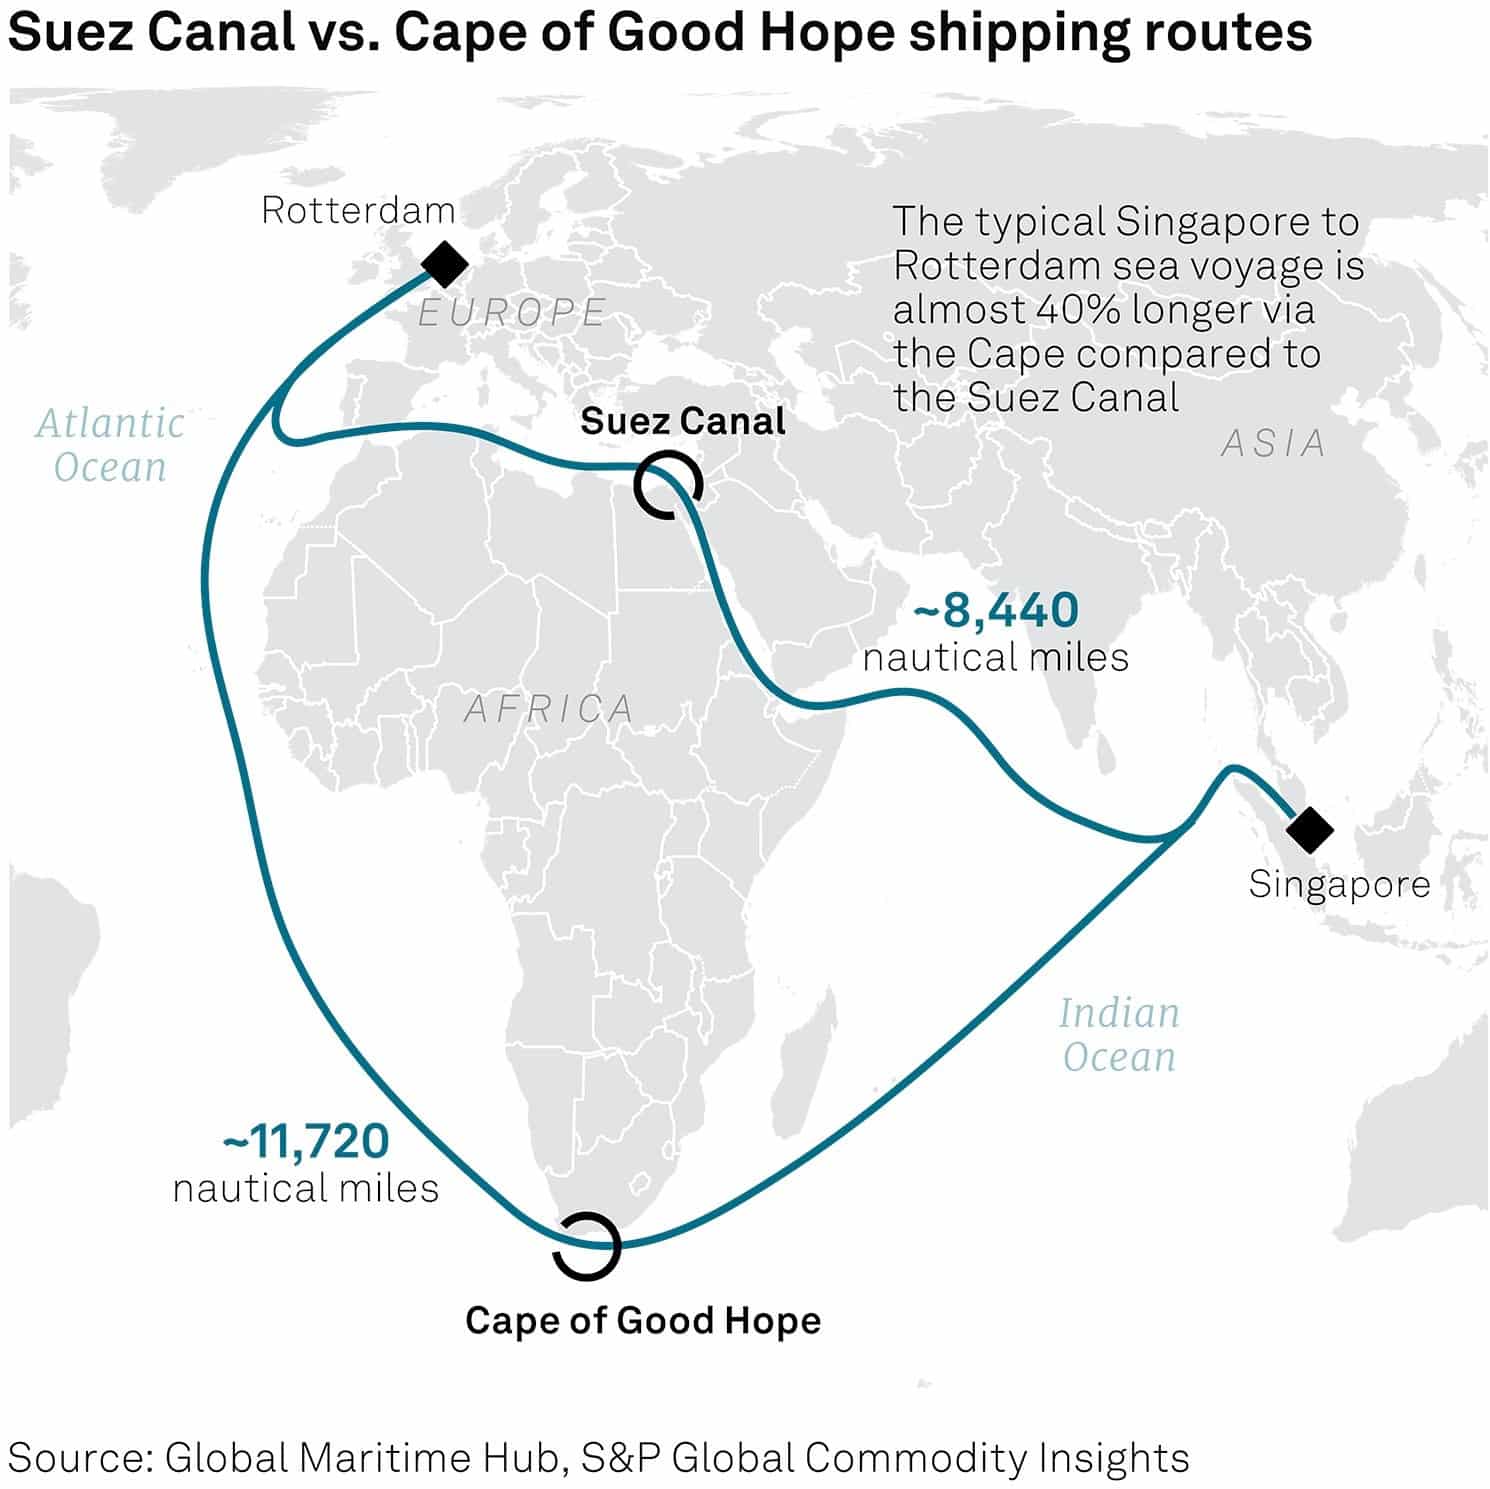
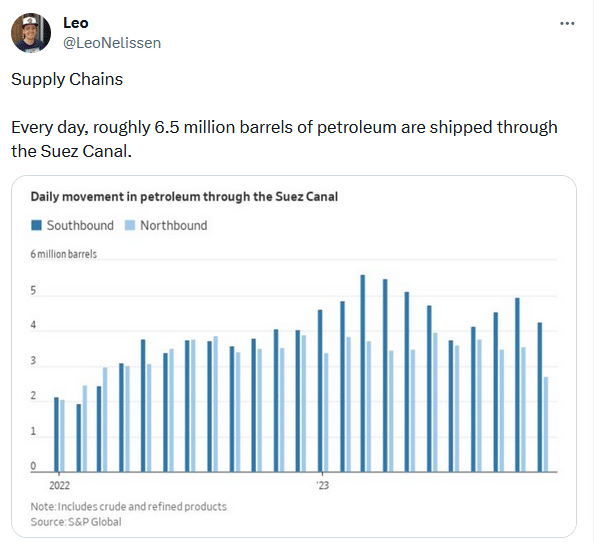
Houthi rebels are attacking Red Sea vessels and greatly limiting traffic in one of the world’s most critical shipping lanes. Four of the world’s five largest container shipping companies, accounting for slightly over half of the world’s container traffic, have suspended transit through the Red Sea. As the graphic below shows, the alternative route, around South Africa, adds about 40% to the distance and, therefore, more time and energy expenses. Over 10% of all oil and 20% of container traffic are shipped through the Red Sea.
If the Houthi rebels continue to wreak havoc on this vital shipping lane, might it rekindle inflation? ISI Shipping Analyst Jon Chapell via Freight Waves thinks it is possible – “In a worst-case scenario, in which Red Sea transits for all ship types are heavily curtailed, we could see freight prices go up multiples — think five to 10 times. These costs would be passed through to the consumers and shippers, and supply chain bottlenecks would re-emerge as the greater distances around Africa would tie up extreme amounts of shipping capacity.” However, he notes a joint naval task force to escort ships could restore confidence, allowing vessels to use the Red Sea again.
We think the blockade may pressure shipping costs higher for some goods, but alternative routes should limit shortages even in the event of a complete shutdown. Further, the U.S. is much less reliant on the Red Sea than Europe and other nations. Per Moody’s, “(U.S.) Shoppers shouldn’t expect the price of the things they buy to rise much, if at all, because of the shipping chaos.“
Economy
Market Trading Update
As we discussed yesterday, sometimes, these markets can do things that make it difficult to know when to stay invested or when to go to cash.
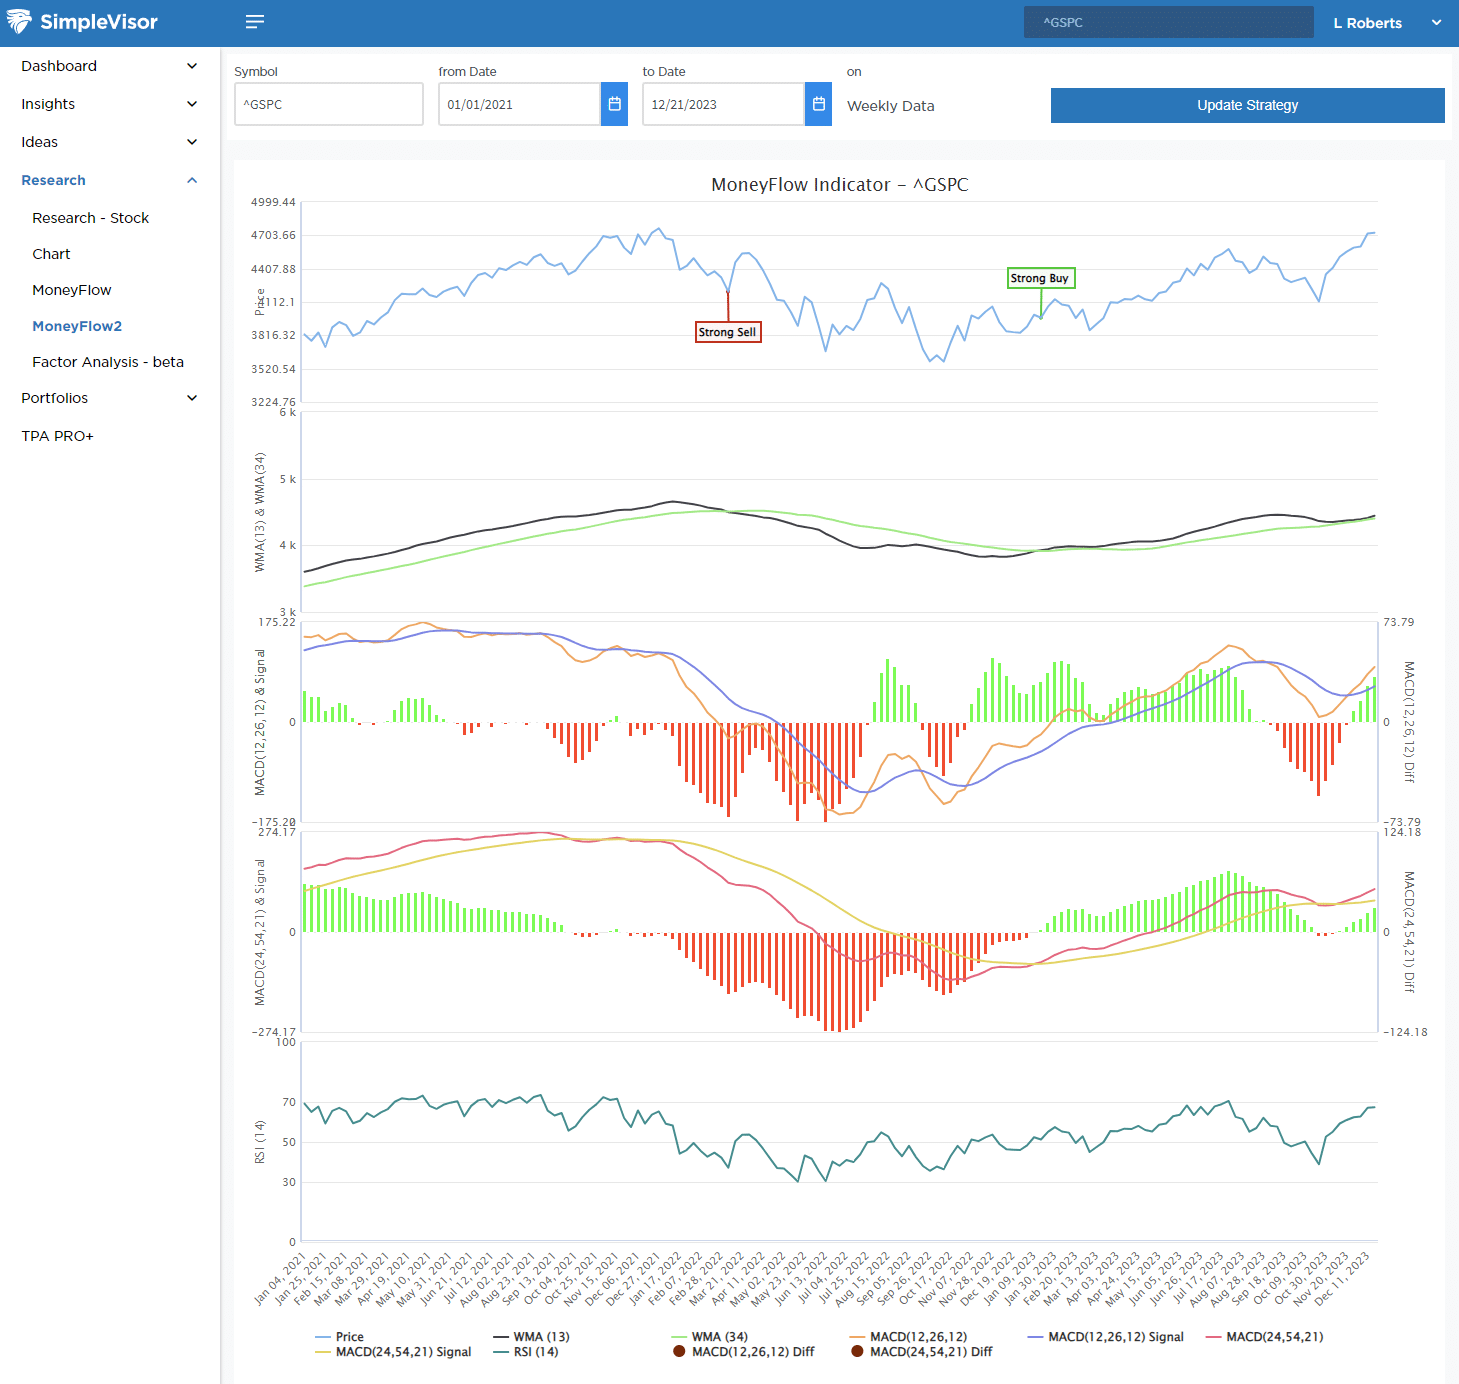
That is why we have added a new MoneyFlow analysis chart to the SimpleVisor platform. The analysis is a bit different than the original MoneyFlow analysis in that it uses WEEKLY instead of DAILY data. This analysis is more suited for longer-term holding periods for investors, but more importantly, acts as an important risk management tool by showing periods when to overweight or underweight allocations to equity risk.
Given that the analysis is based on weekly time frames, it won’t trigger buy or sell signals at the tops or bottoms of markets. However, it does succeed in helping investors maintain long-term equity exposure during bullish markets and reduce those allocations during bearish cycles. This chart is now live on the platform and available for you to use. However, we are still refining the mechanics as we move into 2024.
Inflation Redux?
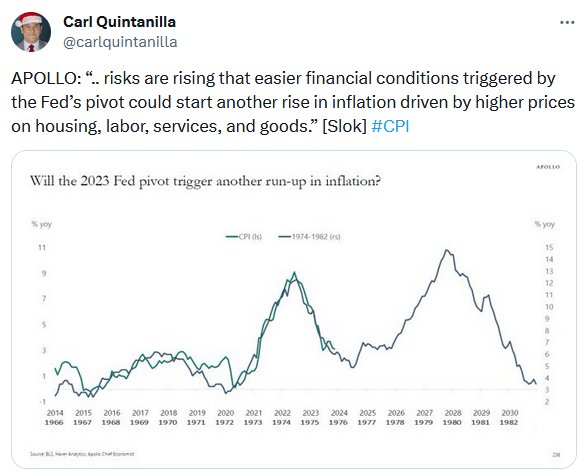
A reader sent us the tweet below and asked for comments. Our thoughts are worthy of an article, but in the meantime, it’s worth putting inflation fears at ease.
Before starting, note that the scales on the two axes are different. Doing so makes it appear that the 1970s and the recent inflation are nearly identical.
Apollo is correct that lower interest rates, higher stock prices, and a robust economy could rekindle inflation. However, any comparison to double-digit 1970s inflation is wrong. The inflation we just witnessed was a function of fiscally fueled demand. Further and equally, if not more importantly, the global economy was shut down. Manufacturing and supply lines were all but closed. Supply-side problems will not drive inflation in the future to nearly the degree it did a couple of years ago.
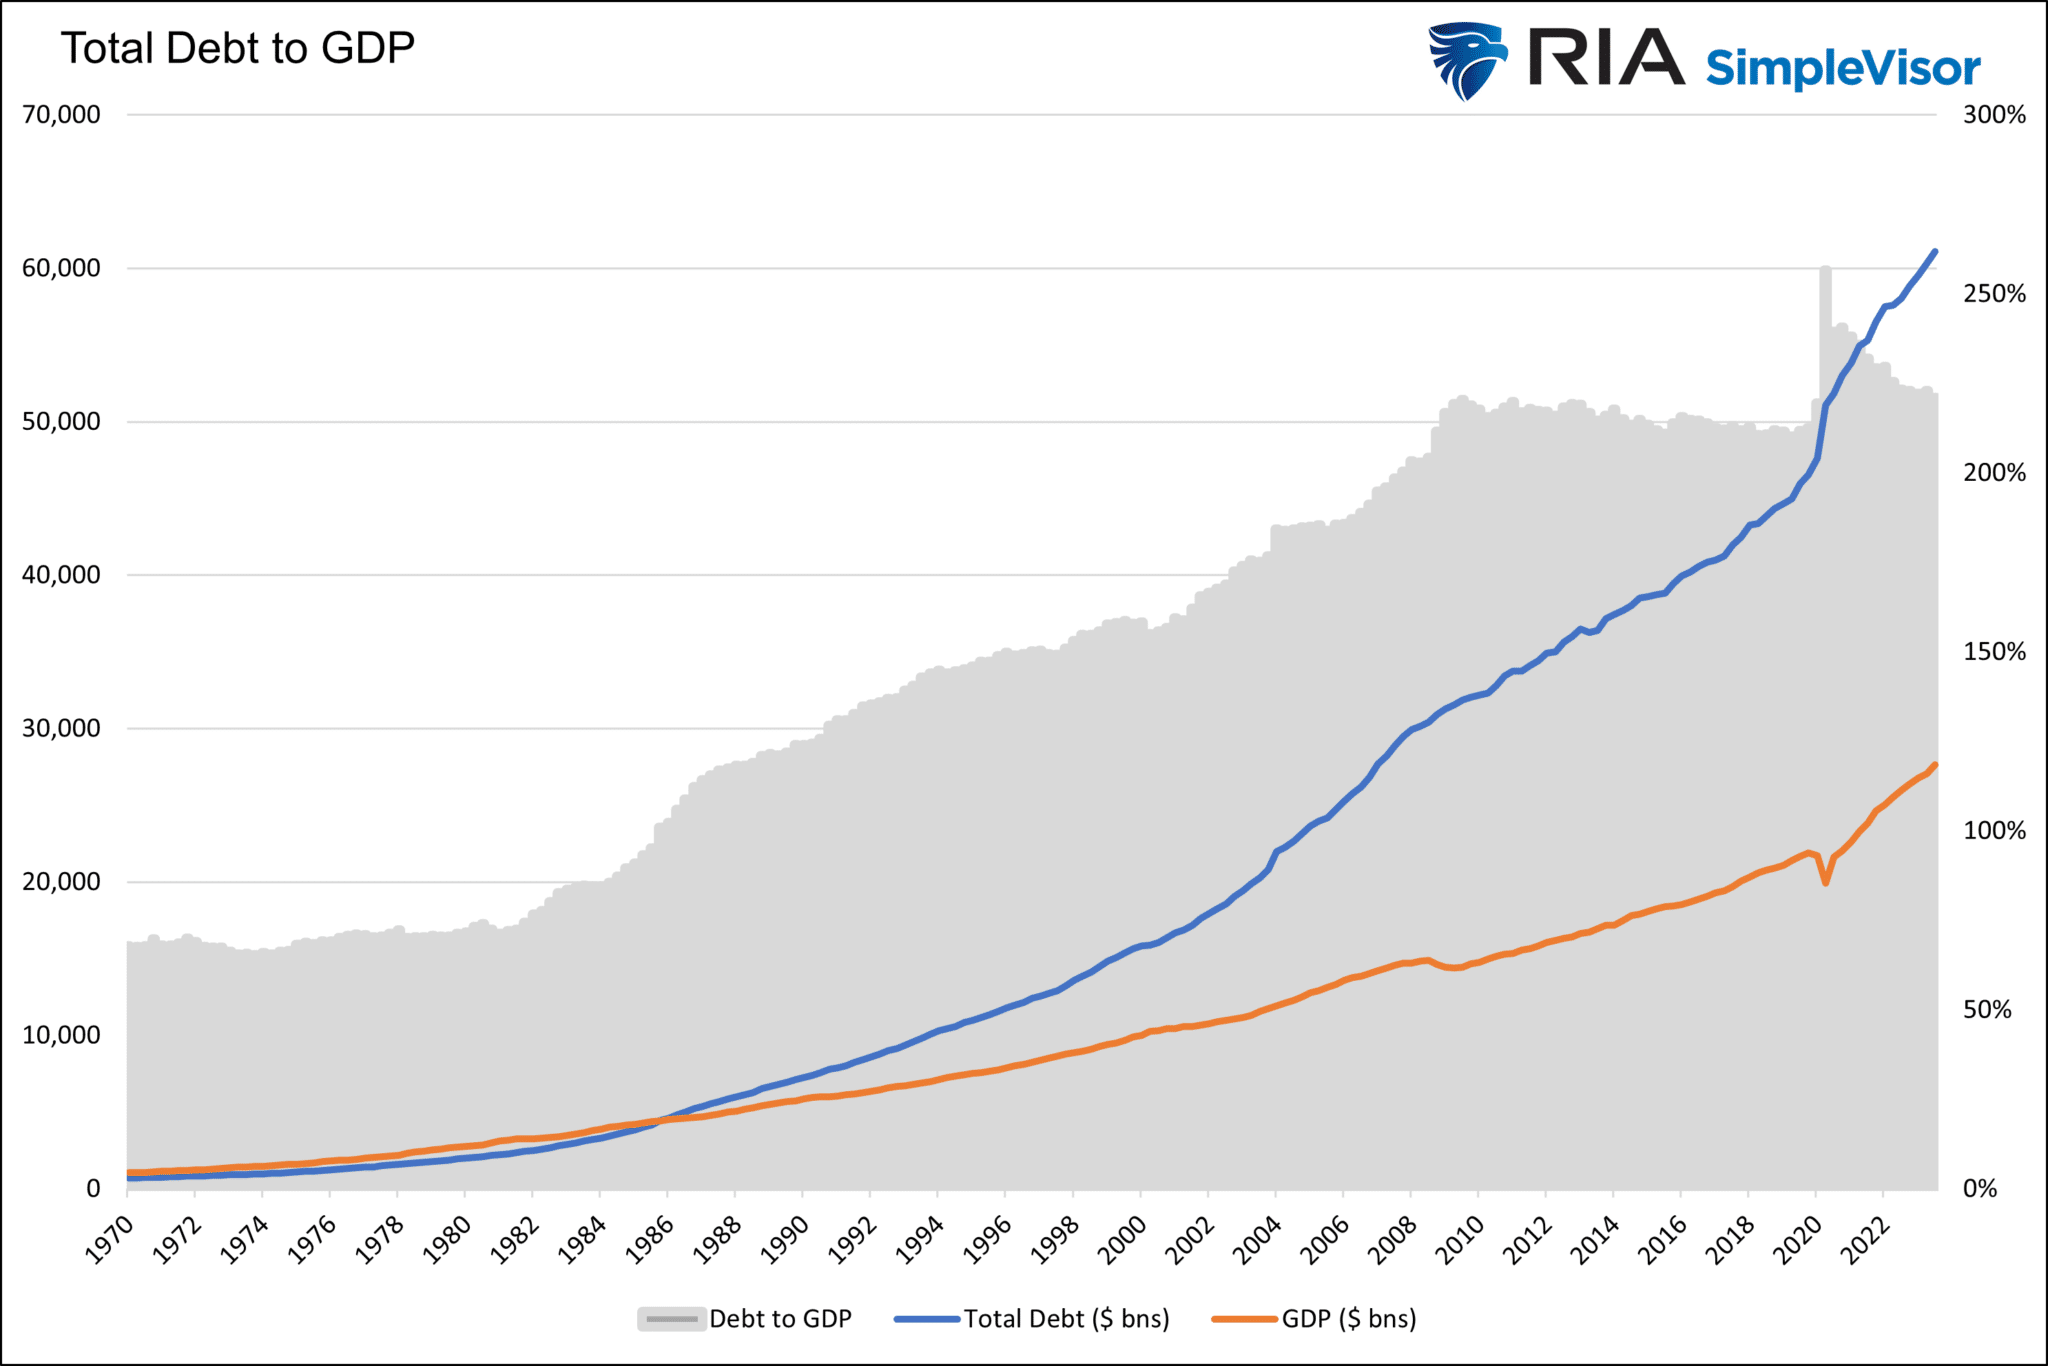
Equally important, today’s natural economic growth rate driven by demographics and productivity is far from the 1970s. The Fed projects the nation’s long-term economic growth rate below 2%. Such lines up with similarly slowing productivity growth. In the ’70s, real GDP and productivity growth were double current levels. Second, debt was not a big problem then. Since the ’70s, debt has grown four times faster than GDP, as shown in the second graph. Given our heavy dependence on debt and, therefore, interest rates, the economy’s ability to tolerate higher inflation is much less than in the ’70s.
Lastly, the population is growing by .50% a year and slowing. It was double that in the 70s. Demographics are a crucial component of economic growth and inflation. Given recent trends, population growth should contribute less to each than in the ’70s.
Philadelphia Fed
Despite a recent bout of good economic data, The December Philadelphia Fed survey was -10.5, which was worse than the expected -4.0. The survey has been negative in 14 of the last 16 months, with just one positive print in the last year. Philadelphia is the sixth largest city and a significant production and transportation hub. As we see in this survey and other manufacturing surveys, the manufacturing sectors continue to struggle despite what appears to be a robust economy.
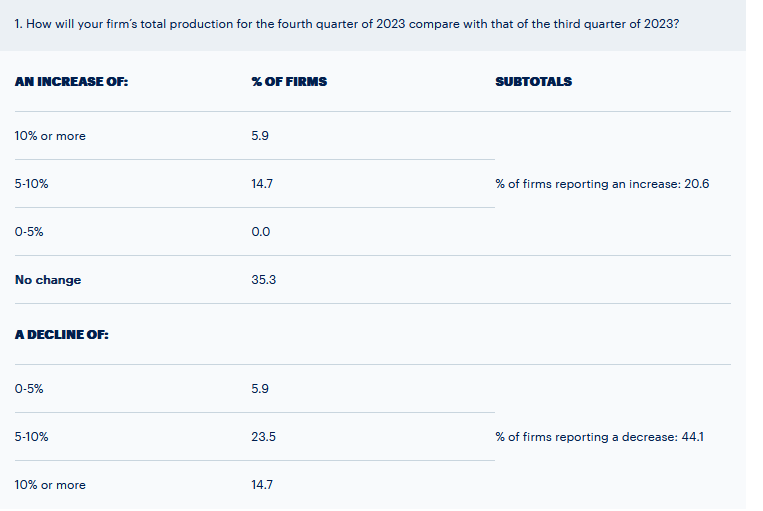
The graphic below shows expectations for the current quarter are weak. Only 20.6% of the firms surveyed see increased production this quarter. 35% see no change, and 44% think it will decline.
Tweet of the Day
“Want to have better long-term success in managing your portfolio? Here are our 15-trading rules for managing market risks.”