
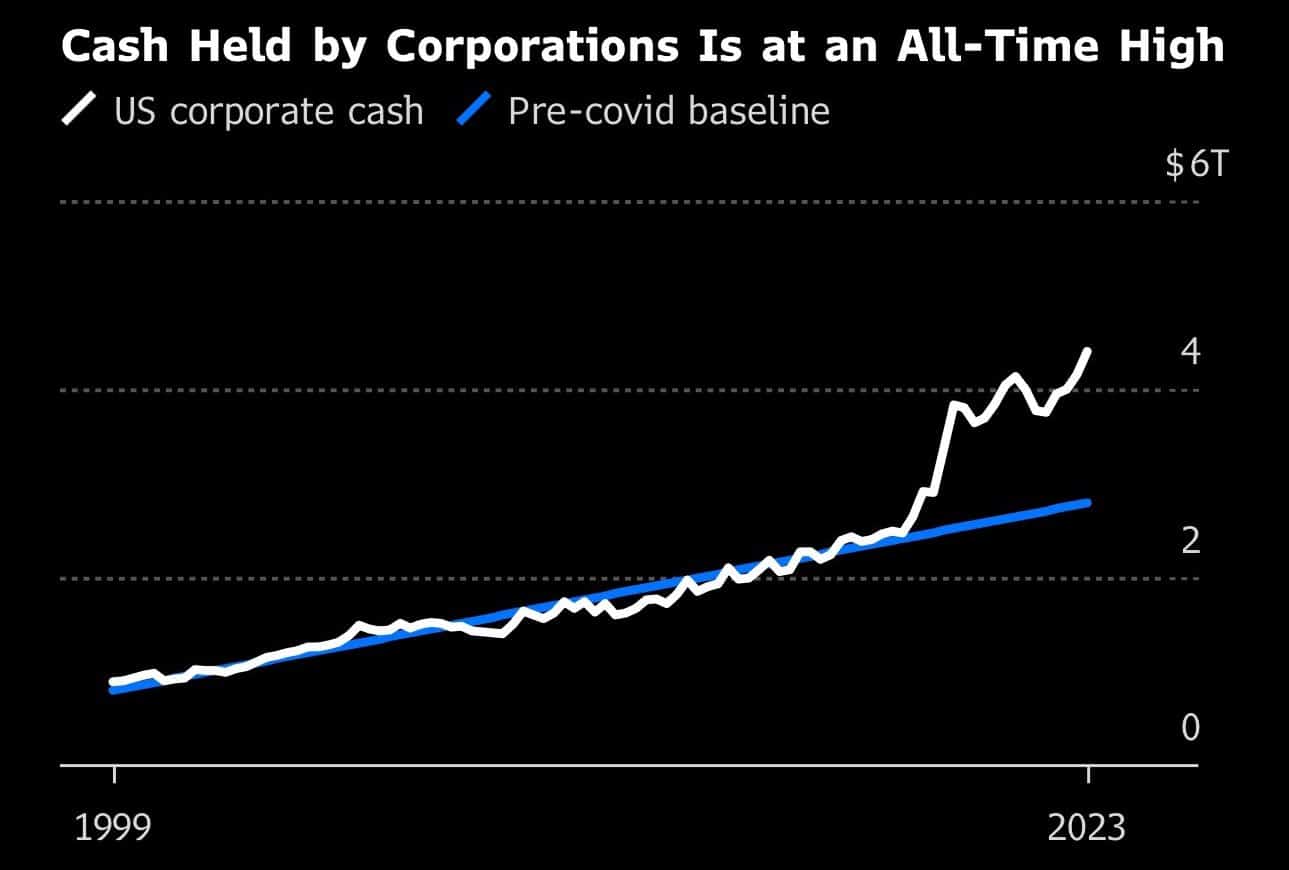
The Bloomberg graph below provides us with a reason to be optimistic about the earnings and share prices of the largest corporations. As shown, the amount of cash corporations hold is at an all-time high and double the pre-pandemic trend. Large amounts of cash are a good thing for shareholders in today’s high interest-rate environment. In the five years preceding the pandemic, corporate debt securities outstanding rose on average by 3.5% per year. In 2020, corporate debt shot higher by 11% as corporations took advantage of historically low-interest rates to fortify their cash and pre-fund future needs. Consequently, corporate debt issuance has been below average, sparing some corporations the need to borrow at higher interest rates.
Additionally, corporations with excess cash are investing at money market rates that are often higher than their borrowing costs. For shareholders, not only does the situation help the income statement, but the cash allows some companies to buy back their shares and provide an additional tailwind to their stock price. The problem is the actions of a few large companies bias the data. Investor’s Business Daily helps us better appreciate the uneven distribution of corporate cash balances. Per their article, 13 corporations held over $1 trillion of cash or a quarter of the total amount in the S&P 500. For example, in aggregate, Apple, Google, and Microsoft held almost $450 billion of cash as of last September.
What To Watch
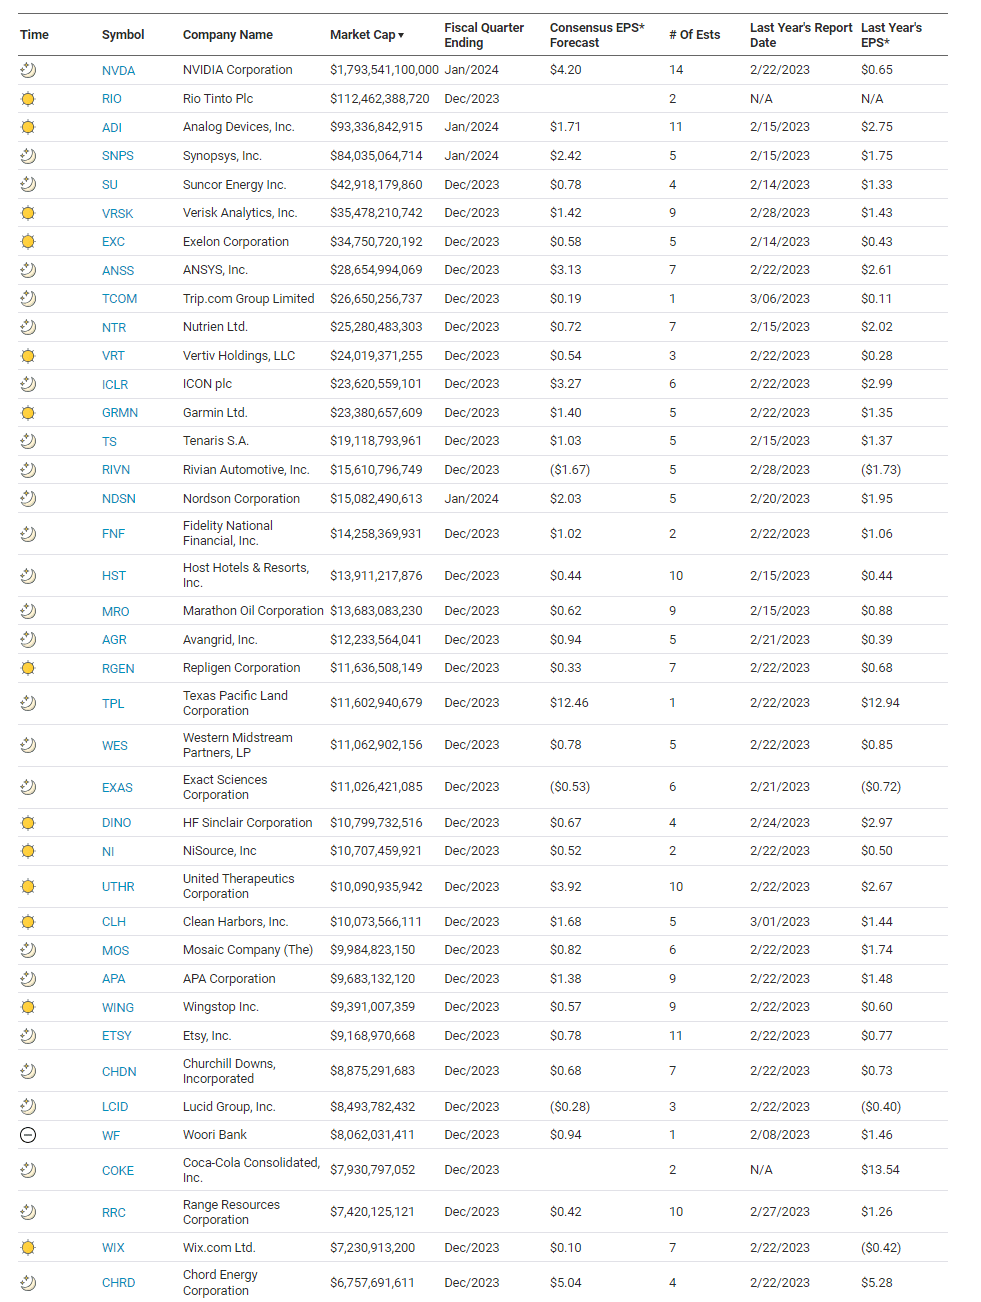
Earnings
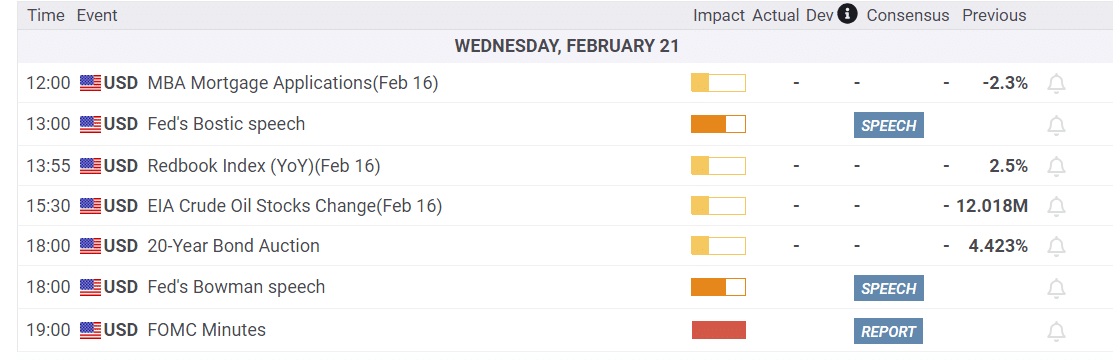
Economy
Market Trading Update
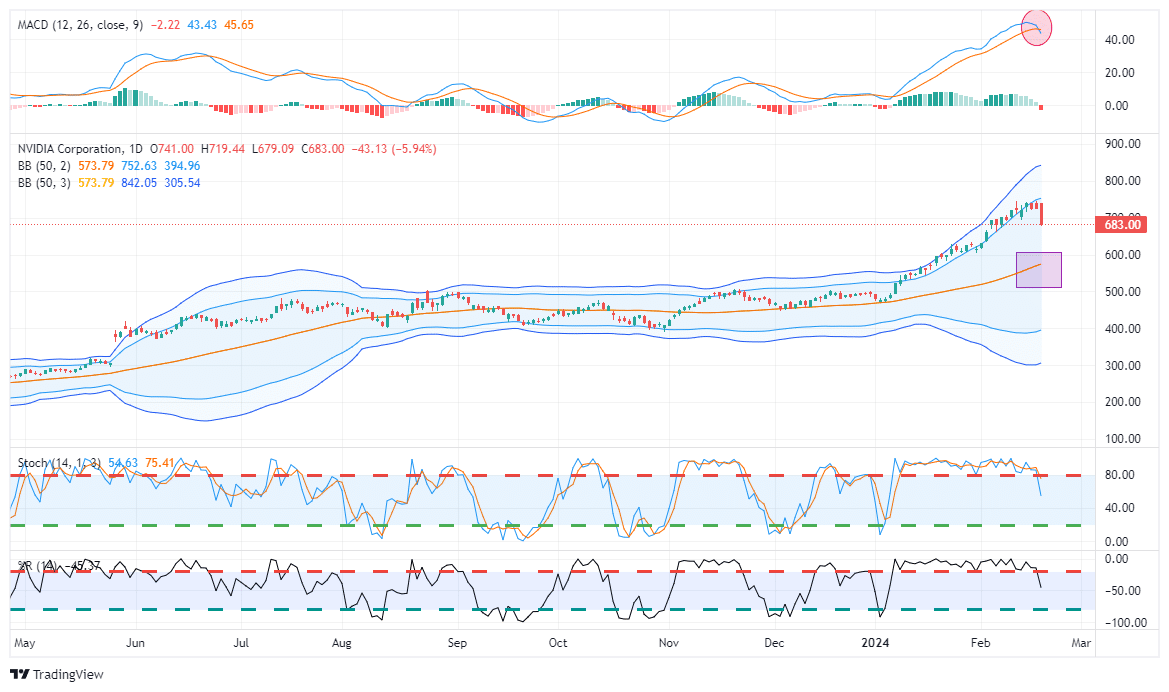
All eyes are on Nvidia today as they report earnings. While the consensus forecast is $4.20, the forecast for revenue growth over the rest of the year will be critical. The risk of disappointment is elevated, so be ready for some volatility in the market over the next couple of days. NVDA triggered a sell signal yesterday from a very elevated level, which is why we took some profits last week. There is decent support at $600/share, so a correction could be deep and swift to work off the overbought condition.
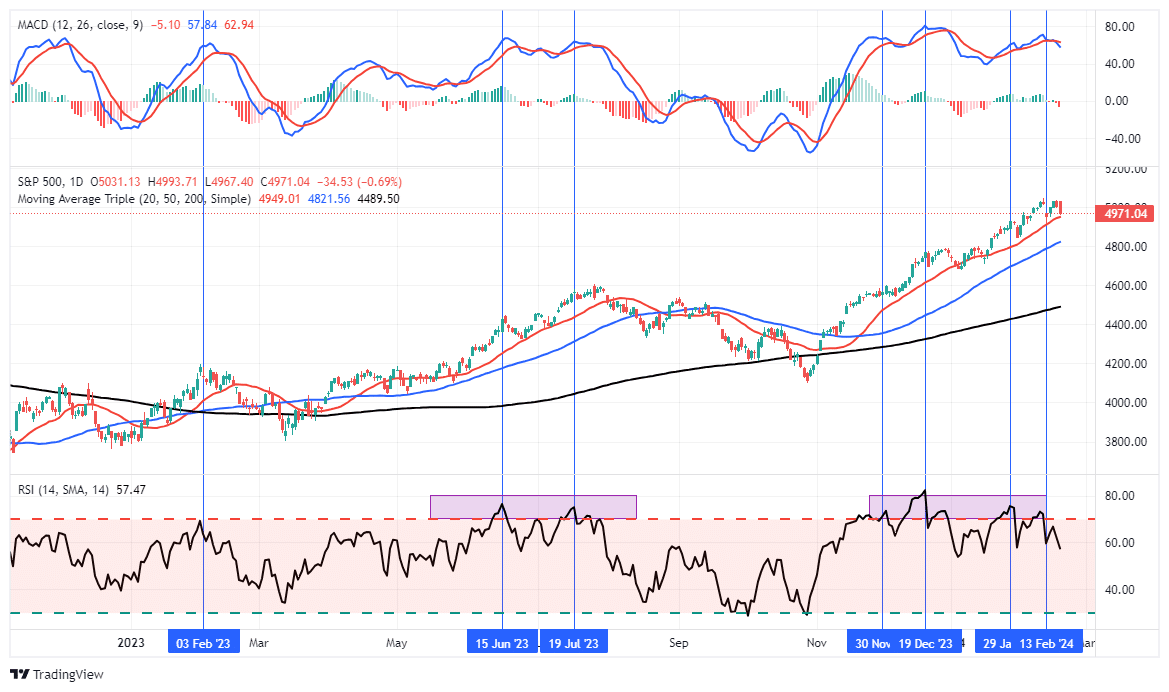
As we noted yesterday, while the overall market remains strong, positioning is becoming very stretched on both a technical and absolute positioning basis. Yesterday’s selloff triggered a short-term sell signal from an elevated level, and the 20-DMA is currently acting as support. A break of that moving average suggests a bigger correction is at play, and we will watch closely for signs of a larger reversal at work. Regardless, the corrective process was needed and should be used as an opportunity to rebalance exposures and move allocations to target levels as needed.
Inflation Expectations
The Fed considers inflation expectations as equally important as recent inflation trends. This is a relic from inflation lessons learned in the 1970s. At the time, they failed to appreciate that if consumers thought prices would rise soon, they would buy something today instead of waiting for tomorrow. Therefore, as inflation expectations rose, so did demand. The result was a circular inflation problem.
Minneapolis Fed President Neel Kashkari published a paper last weekend affirming the importance of expectations. The following quote is from his article, Policy Has Tightened A Lot:
“If supply-side factors appear to be contributing meaningfully to disinflation, what role has monetary policy played and how is it affecting the economy now? Monetary policy has played an enormously important role in keeping long-run inflation expectations anchored. It is hard to overstate how important that is for ultimately achieving the soft landing we are all aiming for.”
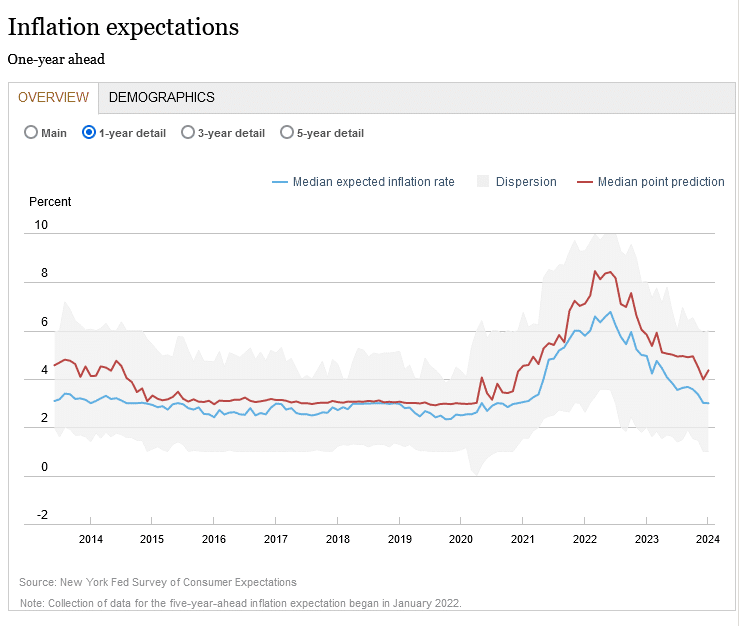
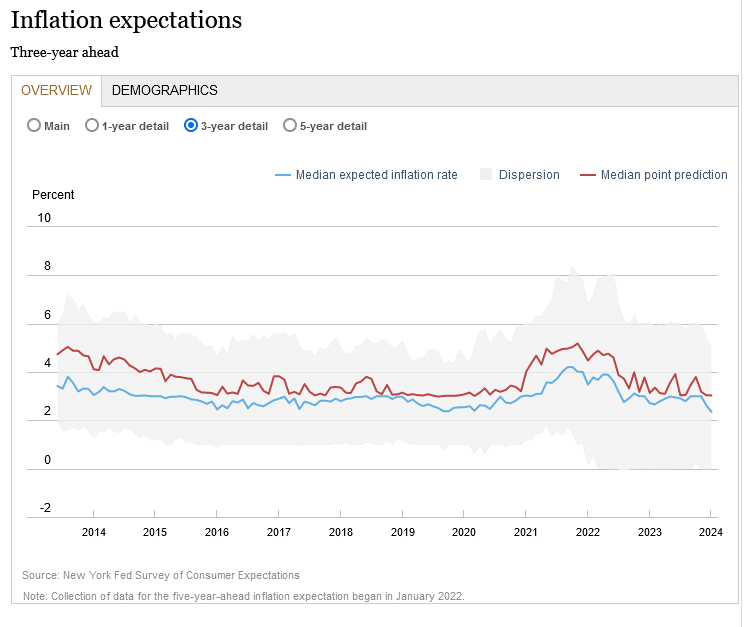
The New York Fed’s latest inflation expectations survey shows inflation expectations are falling. The first graph shows that expectations for inflation a year from now are closing in on pre-pandemic levels. The three-year inflation expectations have now fallen below pre-pandemic levels, with the low range of those surveyed expecting zero inflation.
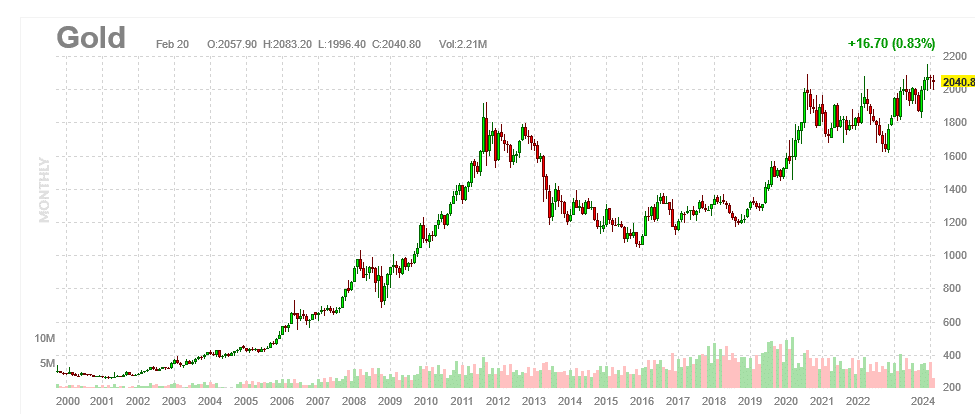
Citi Says $3000 Gold is Possible In 2025
Analysis by Aakash Doshi, head of commodities research at Citibank, points to three catalysts that could significantly propel the price of gold. CNBC below summarizes his justifications for a 50% increase in gold in such a short period.
- “The most likely wildcard path to $3,000/oz gold is a rapid acceleration of an existing but slow-moving trend: de-dollarization across Emerging Markets central banks that in turn leads to a crisis of confidence in the U.S. dollar,” Citi analysts, including Doshi, wrote in a recent note.
- Another trigger that could drive gold to $3,000 would be a “deep global recession” that could spur the U.S. Federal Reserve to cut rates rapidly. “That means the brakes have been cut, not to 3%, but to 1% or lower – that will take us to $3,000,” Doshi said, noting that this is a low probability scenario.
- Stagflation — an increasing inflation rate, slowing economic growth, and rising unemployment — could be another trigger, though Doshi said there’s a “very low probability” of such a scenario.
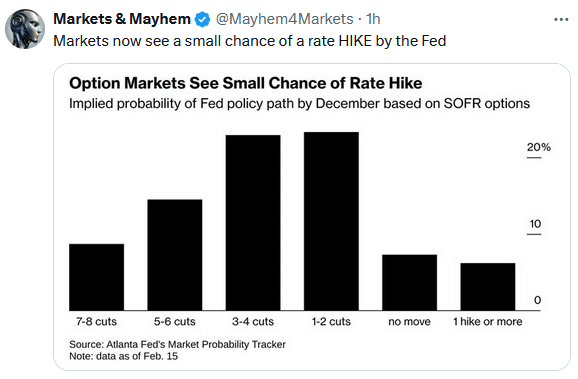
Tweet of the Day
“Want to have better long-term success in managing your portfolio? Here are our 15-trading rules for managing market risks.”