
Written by: Gordon Li, CFA | TCW
“There can be few fields of human endeavor in which history counts for so little as in the world of finance.” – John Kenneth Galbraith
Often labeled as the dour cynics of the asset management community, fixed income investors have long been the butt of jokes when the going appears to be good. As is the case in the world of investing, “extreme brevity of the financial memory” routinely blurs the line between unyielding pessimism and healthy skepticism, where the deafening chorus of “it’s different this time” drowns out the warnings from those with clear-eyed assessments of risk. Put simply, when we hear a story too good to be true, our duty as value investors compels us to question deeply its merits.
Consider the tale investors in the bull camp have bought into today: the economy has, and will continue to, shrug off an inverted yield curve and a global tightening cycle of historic proportions. The inflation tiger has been corralled back into its cage, while a robust labor market and healthy consumer spending will launch the economy into cruising altitude – a cycle and gravity defying “no-landing.” However unresolved, and dare we say, wishful, the arguments fueling the prevailing “no-landing” narrative, risk assets have apparently decided that the debate is done and dusted. Indicators of equity and cedit risk have returned to historical norms in recent months as complacency has driven fear from the markets and spurred investors to venture out the risk spectrum. To be sure, “normal” pricing of risk in decidedly less-than-normal times is certainly not an indication of bargains on the table. Lest investors forget the mathematical tenet that robust returns and high prices today equate to lower prospective returns and the greater likelihood of softer prices tomorrow. Another flagrant display of artless extrapolation as it were!
Convexity/Equity/Credit Risk
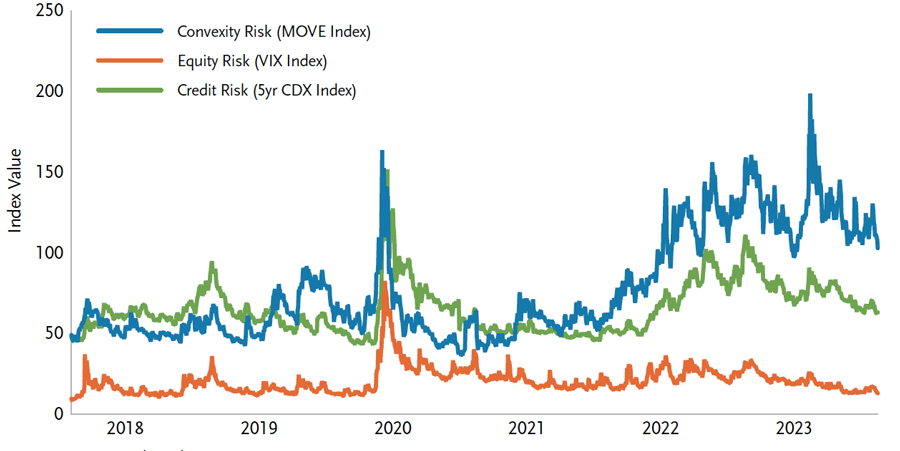
Source: Bloomberg, TCW
When seeking out opportunities in bond-land today, one sector of the market has stuck out like a sore thumb: convexity risk. Indeed, the rate-centric volatility that has come part and parcel with Fed uncertainty has produced outsized opportunities in the agency mortgage-backed securities (MBS) sector, with spreads retesting levels last observed during the depths of the COVID-19 crisis. Putting into perspective just how poorly convexity risk has fared relative to credit as complacency has overrun the markets, year-todate cumulative excess returns of the Bloomberg Investment Grade Corporate Index now lead that of the Bloomberg MBS Index by 213 basis points (bps) as of this August. Capitulating to the “wisdom” of the crowd, the market today is offering agency mortgages at a roughly 50 bps spread premium to investment-grade corporates and 75 bps cheaper than average valuations in the last decade – an offering that we have been keen to mop up. A new long-term steady state for bond valuations ushering in a roaring economic “no-landing,” or an ephemeral short-term aberration? We would wager that it’s the latter!
MBS vs. Corporate Index Excess Returns YTD IG – MBS Basis
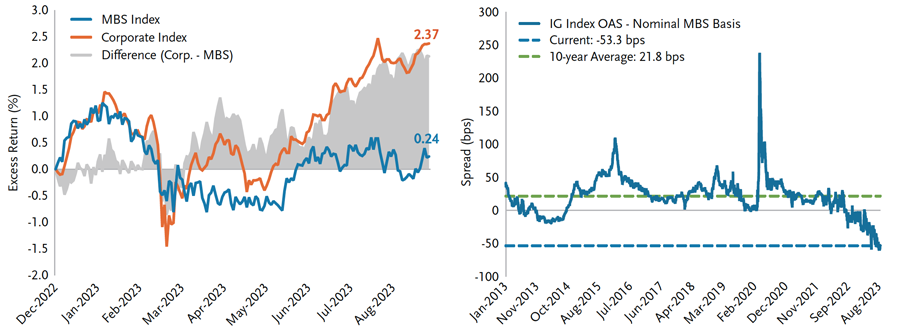
Source: Bloomberg, TCW
This dislocation in agency mortgages, the highest rated and most liquid spread asset, has resulted in the sympathetic cheapening across correlated securitized sectors. Indeed, as convexity risk has struggled this year, securitized assets have generally lagged their credit counterparts. A glance at spreads today offers an apt illustration of the prevailing valuation landscape. With index spreads for investment grade and high yield corporates compressing to the 30th to 40th percentiles over the past two decades, in stark contrast to spreads in securitized sectors hovering in the 50th to 90th percentiles, the value proposition on offer in securitized assets today is extremely compelling. In other words, capturing high quality spread in bonds backed by robust fundamentals, bulletproof structures, and cold hard cash (flows) makes much more sense to us today than banking on the promises of corporations, especially against backdrop of the current economic backdrop and risk premiums.
Spreads Current Value Percentile (Since 2003)*
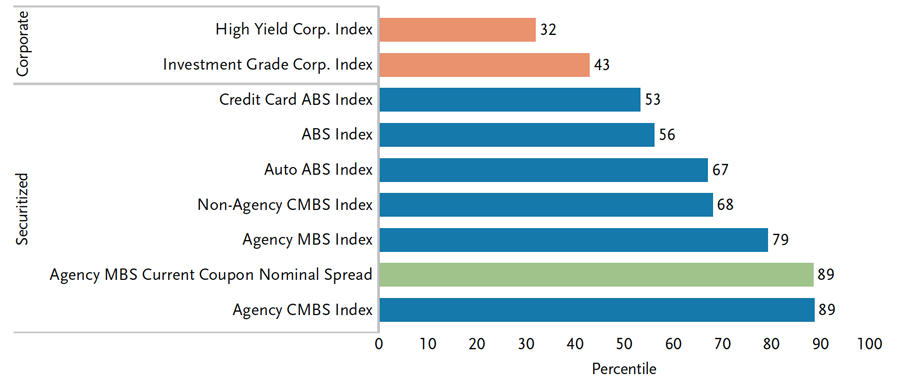
Source: Bloomberg, TCW
*Non-Agency CMBS and Agency CMBS data from 2008 and 2014 respectively
On the subject of robust fundamentals, the housing market is one area that has proved resilient even as other parts of the consumer economy continue to take punches from the “long and variable” lags of a tighter monetary policy regime. As of the June reading, the Case-Shiller National Home Price Index is up 4.7% this year; even as mortgage rates eclipsed 7%, the highest reading since the early 2000s.
Higher mortgage rates lead to higher home prices!? Add another to the list of the Fed’s technical blunders! Courtesy of Quantitative Easing-infinity, the Fed hosted a refinance wave of historic proportions in 2020 and 2021, “locking in” the bulk of homeowners to fixed-rate mortgages on the order of 2% to 3%. Adding some perspective, adjustable-rate mortgages1 peaked at roughly 35% of the pre-Global Financial Crisis (GFC) mortgage market. Today, that number is a far more modest 6%. Not only has the housing market been largely immunized to immediate interest rate shocks over the short term, a record 15-year run in home prices has compressed the aggregate housing market loan-to-value ratio to 30% (in part due to a ride on the Zero Interest Rate Policy highway), likely contributing to longer, not shorter, lags this cycle when all is said and done. Adding to supply woes, the housing market remains defined by over a decade of underbuilding following the GFC, a structural issue that will likely take years to resolve. Against this backdrop of strong underlying credit fundamentals, we have continued to favor senior 2.0 structures, priced at over 3-point discounts to agency MBS and offering close to 200 bps of “safe” spreads.
Housing Completions vs. Household Formations
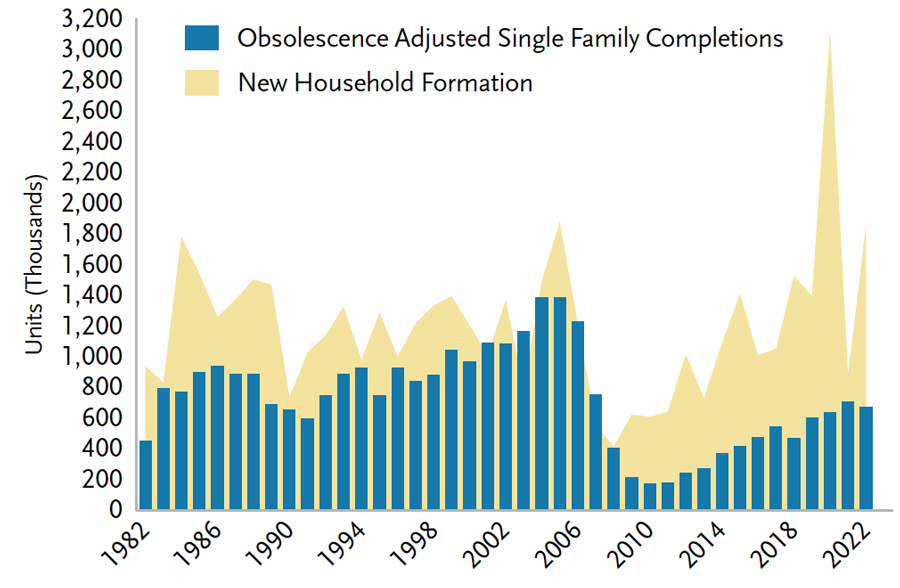
Source: Bloomberg, Mizuho, TCW
Existing Home Sales Inventory and Months Supply
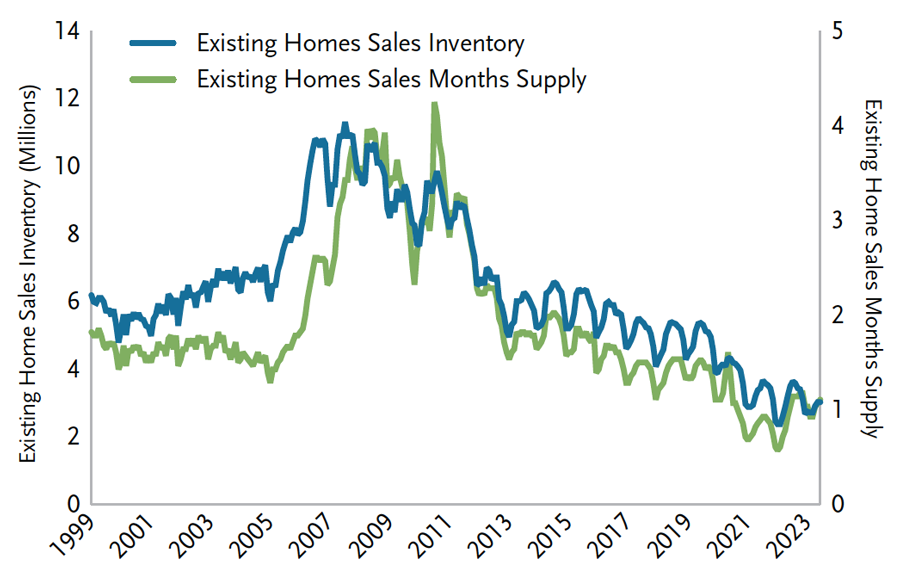
Source: Bloomberg, TCW
The history of financial markets is littered with the wrecks of post-tightening “hard-landings.” Those making bold and seemingly prescient calls on the whimsical premise that “it’s different this time” are inevitably left sorting through the wreckage upon the realization that the old rules, indeed, still apply. Rather than heed these lessons of history, the human condition has often compelled investors to dismiss them as the “primitive refuge” of those lacking the insight to appreciate the “wonders of the present.” In recent months, those same calls have only grown louder.
Precious little about the future can be said for certain in the realm of investing; however, ignoring the lessons of history and venturing out the risk-asset spectrum on diminished prospective returns and skinny risk premiums is certainly the wrong thing to do. Much as it might be tempting – and easy – to buy into the “no-landing” narrative and hitch a ride on the perpetual motion machine on its upswing, markets have long demonstrated that the tangible reality of gravity is very often the next oscillation in the cycle.
Related: Is This Time Different- Unpacking Bond Yields