Written by: Kevin Flanagan | Wisdom Tree
One of the lynchpins behind the Federal Reserve’s (Fed) decision-making process thus far in 2017 has apparently been the altered inflation landscape. The policy makers seem to be more comfortable that deflationary conditions have passed and that inflation will be “running close to the Committee’s 2 percent longer-run objective.” Does that mean that fixed income investors should be fearful of the inflation bogeyman rearing its ugly head anytime soon?
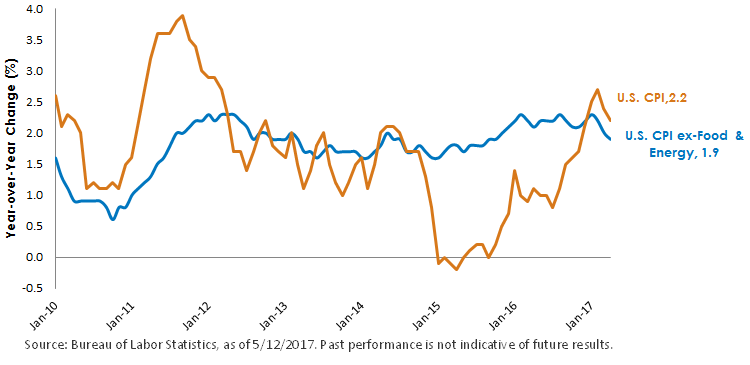
Calendar year 2017 did get off to a somewhat unexpected start on the inflation front. Indeed, the Consumer Price Index (CPI), perhaps the most widely followed gauge on price developments, revealed some visible upside during the winter months. According to the Bureau of Labor Statistics (BLS), overall CPI rose as high as +2.7% in February on a year-over-year basis, the strongest performance in five years. In fact, as recently as July of last year, the figure came in as low as +0.8%. The Fed’s preferred measure of inflation, the price index for personal consumption expenditure (PCE) exhibited a similar pattern, coming in at a five-year high watermark of +2.1% and crossing the FOMC’s mentioned 2% threshold in the process.
U.S. CPI vs. U.S. CPI ex-Food & Energy
Year-over-Year Change from 1/31/2010 to 4/30/2017
Interestingly, inflation has not exhibited any further upward momentum in the months that followed. To provide some perspective, the year-over-year gains for CPI and the PCE price index have since dropped back to +2.2% and +1.8%, respectively, in the latest data available. Core inflation, such as the CPI excluding food and energy, is another closely monitored inflation gauge, as it removes those sometimes-volatile components and is viewed as a better barometer of demand pressures within the underlying economic setting. In the most recent BLS report, the 12-month increase for CPI ex-food and energy had slowed to +1.9%, the lowest tally since October 2015.
One area of importance when focusing on the potential for higher inflation is wages. The latest monthly jobs report did not display any further upside on this front, as average hourly earnings rose at an annual rate of +2.5%, well within the recent band, since this time last year. A broader measure of compensation is the Employment Cost Index (ECI), which includes wages and salaries as well as benefits, and is measured on a quarterly basis. For the three months ending in March, the ECI posted a 12-month gain of 2.4%, the highest reading since 2008, certainly a trend for fixed income investors to keep an eye on in the months ahead.
Conclusion
Inflation expectations and actual inflation data should continue to be watched closely by both the Fed and the fixed income markets in the months ahead. Against this backdrop, the break-even inflation rate, or the difference between the yield on a nominal bond (such as the U.S. Treasury 10-Year note) and an inflation-linked or real yield bond with the same maturity (such as the 10-Year U.S. Treasury Inflation-Protected Securities or TIPS), will serve as a useful guide regarding inflation expectations. As of this writing, that rate has actually fallen to 1.84%, as compared to its recent high point of 2.08% in January. Even with this pullback in inflation expectations, the path of least resistance still leads to the Fed implementing another rate hike at its upcoming policy meeting on June 13/14, a development the money and bond markets have fully discounted at this point.


