
Written by: Michael Venuto | Toroso Investments
The growth of smart-beta strategies has been staggering, but quite top heavy.
Meaning, most assets have flowed to factor-based strategies and dividends. I have written in the past about a subcategory of smart beta that I call characteristic indexes . These indexes highlight a business characteristic that active investors often seek through a passive vehicle.
Many of the ETFs that follow these indexes are categorized by ETF.com as “ Alpha-Seeking .” These ETFs allow investors to access buy-backs, spin-offs or IPOs in a low-cost, tax-efficient manner.
The top-performing “alpha-seeking” ETF for the past two years has been the Direxion All Cap Insider Sentiment ETF (KNOW | B-77) . KNOW remains my current top pick for “characteristic” or “alpha seeking” ETF, and here is why:
Why KNOW?
I started due diligence on KNOW with the index data because, like most smart-beta concepts, live ETF data was not available during 2008. This analysis begins by evaluating the Sabrient Multi-cap Inside/Analyst Quant-Weighted Index (SBRQAM), a business characteristic index that investors can obtain exposure to through KNOW.
The index incorporates four key business characteristics:
The process, simplified, is as follows:
Step 1 – Forensic Accounting Component:
Starting with the 1,500 stocks of the S&P Composite 1500, eliminate stocks of companies with very aggressive accounting practices, as identified by Sabrient’s proprietary forensic accounting methodology.
Step 2 – Insider & Earnings Revisions Component:
Four quantitative factors are used to rank and winnow the remaining stocks after Step 1. At least one of these four factors must be positive for a stock to make this cut:
A quantitative overlay ranks the stocks from the first cut to 600 using a forward-looking “outlook score.” This score rewards strong historical and projected growth trends, low current and projected valuation, high quality of earnings, and favorable dynamics of Wall Street analyst estimates. The top 100 stocks from this second cut are used to populate the index.
Step 3 – Defensive Component:
A “defensive sentiment” overlay is used to rank the final 100 stocks. This overlay rewards stocks that historically have performed well in weak markets and have strong free cash-flow yield and strong dividend yield.
The top 50 stocks are then weighted exponentially so that the top 50 represent a range of 2.67% (for the highest-ranked stock) to 0.96% for the 50th-ranked stock, and each of the bottom 50 stocks is given a flat weighting of 0.35% in SBRQAM.
Comparing Indexes
I have selected three broad-based market-weighted indexes as comparison for SBRQAM. Our goal in performing this comparison is twofold:

The S&P 1500 Index and SBRQAM start from the same universe of stocks. The S&P 1500 ranks all of the constituents by market cap, whereas SBRQAM follows the ranking and winnowing process described above. Security Selection
The question is, how well does this security selection process actually work? Below are some key charts to help understand the differences:
View gallery
.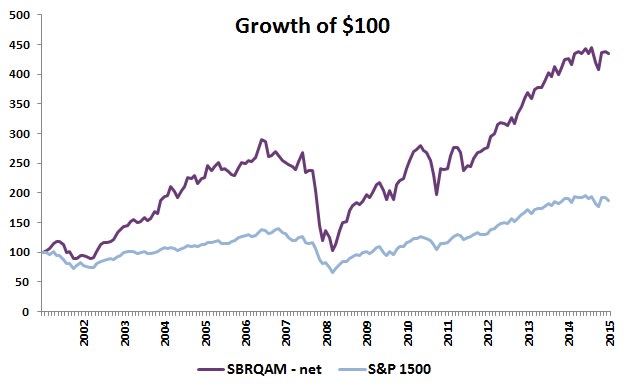
The chart above shows that an investment of $100 would have grown to over $434 since Jan. 1, 2002 if invested in the SBRQAM Index; whereas an investment of $100 in the S&P Composite 1500 for the same time period would have only returned $188.
How Costs Figure In
Both of these calculations measure the change in prices of the underlying holdings and do not take into account the additional costs of investing. However, for the SBRQAM Index, I reduced the price returns by 65 basis points per year to represent the imputed cost of the KNOW ETF (this also applies to the next two charts below).
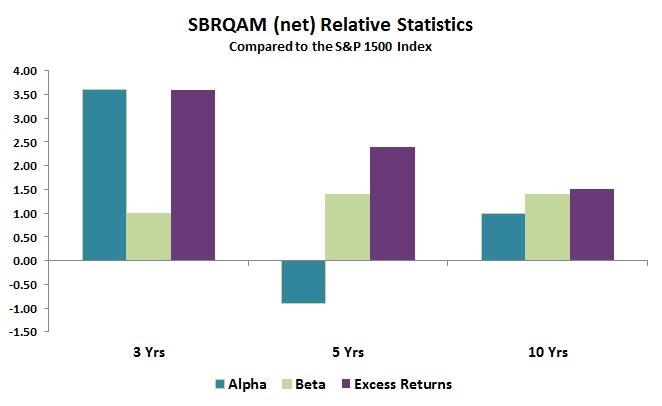
The relative statistics over the last three, five and 10 years, presented in the chart below, show that the SBRQAM Index can enhance the return of a core investment in a market-capitalization-weighted index. The resulting returns are compelling enough to consider an allocation to an ETF tied to SBRQAM, even though SBRQAM has a higher beta than the benchmark index.
View gallery
.
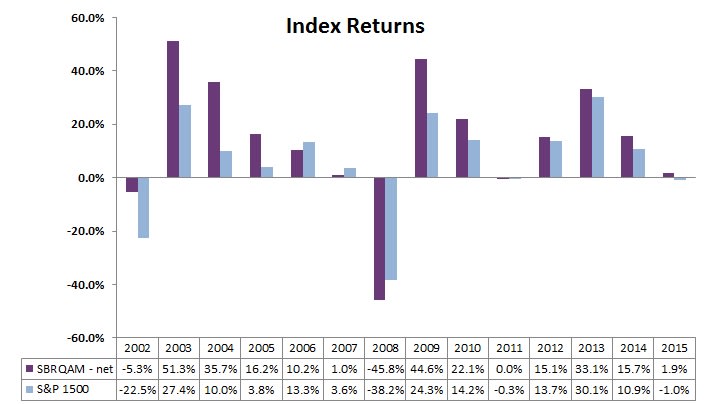
I firmly believe investing in a product such as KNOW that follows the SBRQAM Index creates an opportunity to enhance portfolio returns. The chart below shows returns were stronger in the last seven calendar years. This helps draw the conclusion that it may work well with a core market fund and may provide excess returns over time. However, we should not rely on past performance history alone.
View gallery
.
So, from this point, my due diligence process digs into the fundamentals of the ETF to make sure it improves the overall fundamentals of the portfolio. In my opinion, if the underlying fundamentals are not better, then the likelihood of enhancing returns is diminished.
For here, I look to widely held ETFs that are often used as a core investment to represent the overall market—the SPDR S&P 500 (SPY | A-98 ), the Vanguard Total Stock Market (VTI | A-100) and the iShares Core S&P Total U.S. Stock Market (ITOT | A-100 ). The next chart compares the fundamentals of KNOW to three ETFs as of Dec. 31, 2015:
View gallery
.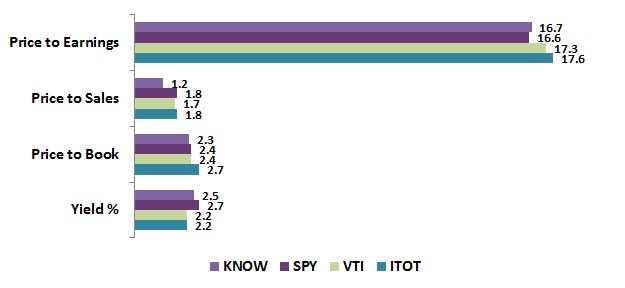
This shows that KNOW seems to have the opportunity to grow more than the broad-based market-cap-weighted ETFs when you look at the price to sales and price to book ratios.
The price to earnings is in line with SPY, and lower than the other corresponding ETFs, although this ratio is subject to a higher-degree accounting judgment when posting a company’s earnings. Price relative to sales and book value have a lower opportunity for such judgments. They may present a more reliable picture of the fundamentals. KNOW also has the highest yield compared with these ETFs.
Overlap
Investors should ask themselves, if the correlations are so high, why has KNOW outperformed these other benchmark ETFs? Evaluate the overlap.
We define “overlap” as the percentage of the ETF that is contained or represented by an ETF to which it is being compared. There is a 12% overlap between KNOW and SPY, an 11% overlap between KNOW and VTI, and an 11% overlap between KNOW and ITOT. The index methodology behind SRQAM and KNOW has systematically chosen securities that have a high correlation to traditional indexing with a portfolio that is 88% different.
In the world of active management, the phenomenon of high correlation and low overlap is called “positive active-share.” This high level of active-share could explain the large positive performance divergence relative to these widely used broad-based ETFs.
Tax Efficiency
One of the key benefits of business-characteristic ETFs is their tax efficiency. According to Morningstar, the annualized turnover of KNOW is 827%, which would generally result in significant capital gains distributions to shareholders of a mutual fund.
However, the unique ability of an ETF to create and redeem shares allows for the distributed capital gains to be minimized significantly. So far, KNOW has distributed capital gains only in one year—2012—when it distributed $1.54 in short-term gains, or about 3%. No capital gains were distributed in 2013, 2014 or 2015.
The Bottom Line
As noted on ETF.com, KNOW has been the best-performing “alpha seeking” ETF for two years, and there is evidence to suggest this positive relative performance can continue. The fundamentals of KNOW, relative to certain broad-based market-cap-weighted ETFs, and are generally considered a better investment opportunity to the “growth at a reasonable price” investor.
The high level of active-share generated by the SBQAM Index makes KNOW an attractive ETF for diversifying core U.S. equity exposure. The tax efficiency of the ETF allow the investor to retain exposure to a series of companies that meet its selection criteria and avoid massive capital gains as the fund holdings turns over. With this ETF, I intend to “stay in the know.”