
Written by: Eugene Steuerle
It’s hard to predict whether health spending growth will slow in the future. And slow relative to what? I’ve long argued that one of the better ways to assess health cost growth is to look at what share of the growth in national income or GDP it absorbs, not at a measure most government and academic researchers use. More on this distinction below.
As our system is currently structured, there are two major forces driving healthcare costs in the U.S.: its open-ended nature, and simple limits on how much cost growth people, their insurance companies, and government can absorb at any point in time.
Demand for better healthcare and longer lives is unlimited. Of course, we want more, especially if someone else pays for most or all of it. When TV ads say, “Ask your doctor,” they are not suggesting you negotiate with the doctor over what price your government or private insurance policy will pay. Perhaps more importantly, some providers have significant power to set their price for a new drug, technological improvement, or procedure, and know that the government and private insurance will often accept that price. Others, such as hospital administrators, seek more conditions and treatments for which they can charge. That’s an open-ended system.
But there are also constraints. Government imposes some for their many types of health insurance programs, but they often tend to be weak. Congress also wavers in its attention to limiting health costs and often relaxes those that already exist.
Some constraints work indirectly through the pressures that cost growth imposes. Consider workers who demand cash wage increases over time. As Sylvester Schieber explains, rising insurance costs at times can absorb almost all of a moderate income worker’s increase in total compensation. Take a worker with total compensation of $50,000 who might normally get a raise of 4 percent or $2,000 the next year, but health insurance cost increases exceed that amount. The worker will put pressure on the employer to raise cash pay, or at least not lower it, and the employer, in turn, may seek some way to buy less costly health insurance.
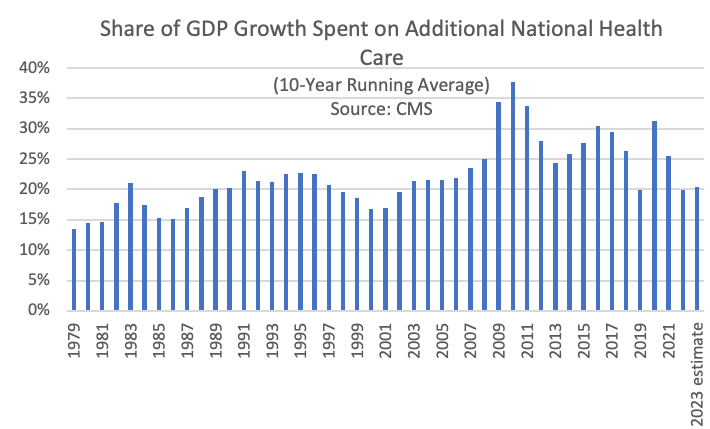
The graph above shows the share of additional GDP spent on additions to total national healthcare spending from start to finish of different ten-year periods. It’s been bouncing around from roughly 15 percent to 35 percent over the 44 periods shown, starting with 1979 compared to 1969 and ending with 2023 (estimated) compared to 2013. Additional Medicare spending (not shown), in turn, absorbs from 3 to 9 percent of GDP growth.
In some recent years, healthcare spending has seemed to slow down relative to the recent past. Using a simpler definition of health cost growth, New York Times reported data indicating that health cost growth in Medicare has receded, and Paul Krugman jumped into this issue, arguing that maybe our fiscal policy path toward ever higher debt-to-GDP might not be on as bad a path as often projected.
It’s important not to jump too quickly to conclusions here. In 2020 and 2021 especially, COVID-19 temporarily changed the way the public interacted with the healthcare system. Many stayed away from hospitals, while the death rate for the population and, particularly, the elderly, rose. Inflation in 2022 then reared its head faster than healthcare providers could raise their prices. In 2023, almost everyone predicted a recession that still has not occurred. It’s hard, therefore, to know how much the experience of recent years has changed what providers charge, patients demand, and both private and government insurance pays.
Still, utilizing the type of data in the graph above gives little hope that future healthcare costs will fall below one-fifth of all income growth, but maybe they will stay below the 25 or 30 percent figures of the recent past.
Now for a bit of wonking out. The type of measure used by most government and academic researchers suggests that if health costs stay at share of GDP previously obtained, be it 20 percent or 100 percent, there is no “excess” cost growth because health costs now are growing no faster GDP. That’s wacky! It says that when new health costs absorb 20 percent of additional GDP in a world where total health costs equal 10 percent of GDP, then the cost growth is excessive. But when average costs reach 20 percent of GDP—close to the level we have reached now—then new growth at 20 percent share of GDP is not excessive.
Not only is that methodology questionable, but so is the language. If health costs are absorbing an “excessive” amount of economic growth, they don’t stop being excessive simply because they have become habitual. And whereas absorbing 15 percent of additional GDP for decades would have been defined as “excessive,” today it would be defined as “curtailed.”
Back to the original question. The jury is still out on whether health cost growth is slowing, by any measure. The movement of surviving baby boomers into their 80 and 90s won’t help. The danger is that the prediction of slower growth can easily lead Congress further to avoid its job of budgeting, hence making the prediction the source of its own failure.
Related: The Big Picture: Growth vs Value