
Although we are living through extraordinary human and economic conditions, clues about what the future may hold can be found by connecting the past to the present. The beginning outline for the shape of things to come is being drawn now. Massive governmental actions and decisions are trying to create a trajectory for mitigating long-term impacts. The success of these decisions is yet to be determined, but that anchor has been set and provides a glimpse into the future.
The Past
We have almost a century of detailed data for the U.S. stock market that we can easily examine for long term trends. The simple Growth of $1 Graph below details the current value of how $1 invested in the S&P 500 has grown over the 94 year period ending December 31, 2019.
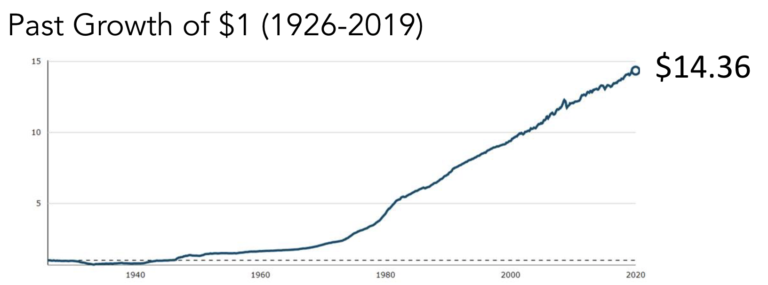
Many investors ignore this long-term data because they believe it isn’t reflective of today. While there are always distinctions from any previous timeframe to the present, a swath of data this large certainly holds useful information for the future.
The Present
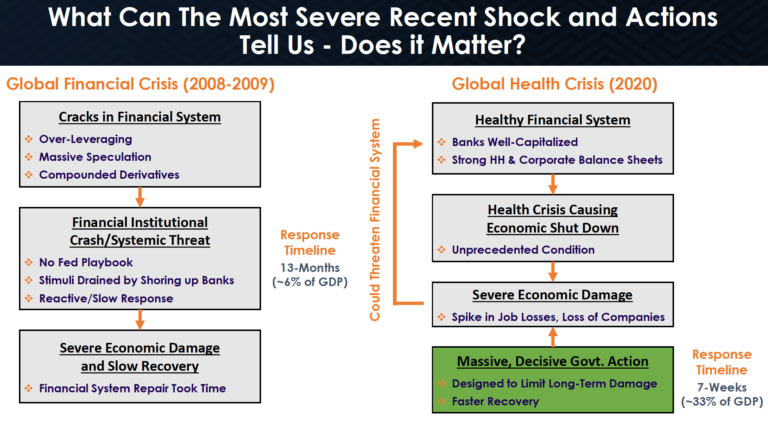
Perhaps the best way to look at investing today is to compare the financial crisis a dozen years ago with the current environment. The chart below shows the differences between the 2008-2009 timeframe and the present. Perhaps most startling is the sheer breadth of the governmental response today versus 2008. The totality of these actions in 2008 took 13 months and amounted to about 6% of GDP (Gross Domestic Product). The current health crisis has seen a very quick set of decisions that total about 33% of GDP!
From the perspective of the stock market, the S&P 500 Index declined from February 19-March 23 by about 34%. Since that point in time, the S&P 500 has scaled a huge “wall of worry” to increase by about 31% (from the March 23 lows) as of this writing.
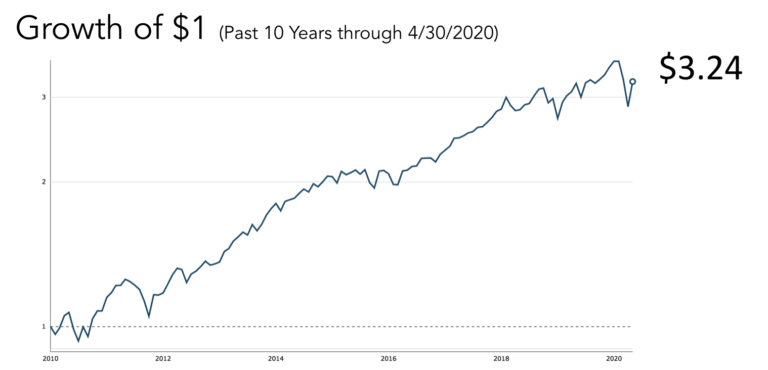
This simple chart details the past 10 years through the end of April.
The Future
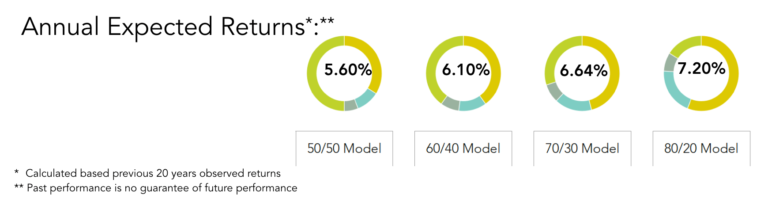
No one can predict the future, but we certainly can use the past and present to inform our decisions about the range of probabilities. In constructing client portfolios (always aimed at connecting client values with their “why”), we look at actual observed returns for the past 20 years in order to provide some basis for what type returns might be expected for a given portfolio allocation.
While the previous 20 years could differ from the next 20, this is a reasonable place to start. This look back period includes 4 significant periods of market decline (which is about what is expected over longer time frames of history), as well as, a long bull market.
The chart below details the approximate annual (net of fees) expected returns for our current model portfolios with allocations from 50% stocks and 50% bonds up to 80% stocks and 20% bonds.
Successfully navigating the stock market starts with an understanding of market history, the past. Adjusting your investing approach from time to time based on new reality, the present, is indicated from time to time. Your investment allocations and your behavior will largely determine your future. Start there. Ready for a real conversation?